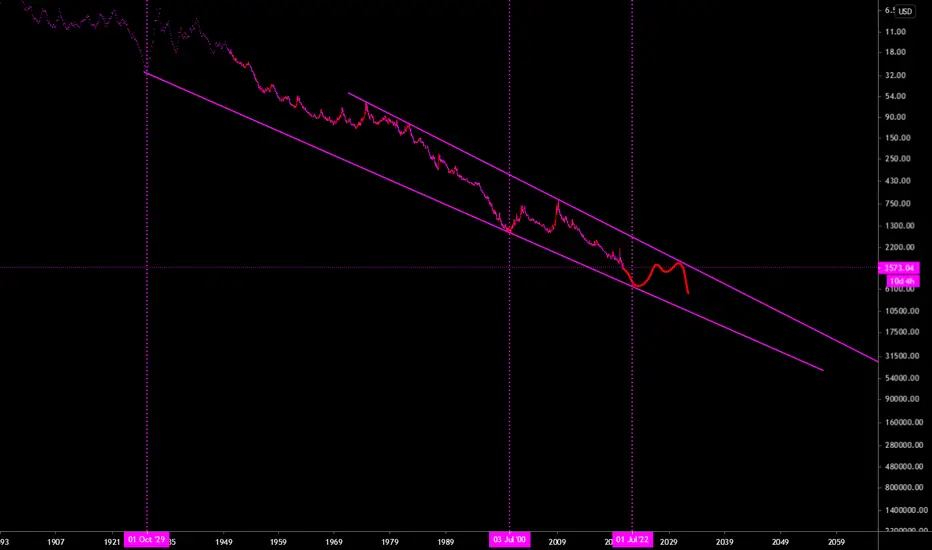
*INVERSE CHART - I like to look at it from different angles, we have the touch from 1929 and 2000 and it should interact in 2022-2023 at around 5800-6000 SPX
Don't speculate or listen to the news, it's all in the charts.
Disclaimer
The information and publications are not meant to be, and do not constitute, financial, investment, trading, or other types of advice or recommendations supplied or endorsed by TradingView. Read more in the Terms of Use.
Don't speculate or listen to the news, it's all in the charts.
Disclaimer
The information and publications are not meant to be, and do not constitute, financial, investment, trading, or other types of advice or recommendations supplied or endorsed by TradingView. Read more in the Terms of Use.