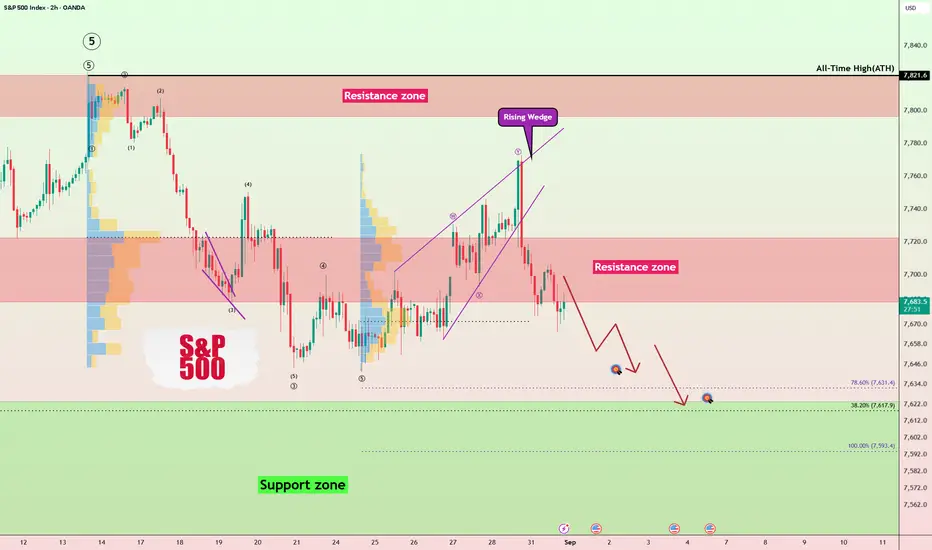
After Warsh’s remarks pushed the U.S. Dollar Index(DXY) and the U.S. 10-Year Treasury Yield higher, the S&P 500( SPX500) moved back below the key $7,720 trading level.
The index is now trading below the Resistance Zone, while macro and geopolitical risks continue to build.
Can the S&P 500 reclaim $7,722, or is a deeper correction toward the Support Zone beginning?
Macro Outlook
Warsh’s hawkish remarks strengthened the U.S. dollar and pushed Treasury yields higher, creating additional pressure on U.S. equities.
At the same time, renewed military tensions in the Middle East remain an important risk factor. Any escalation could put further pressure on the S&P 500 and broader risk assets.
Technical Analysis
From an Elliott Wave perspective, the S&P 500 appears to have completed its corrective waves inside a Rising Wedge Pattern, suggesting that the next bearish waves could now begin.
💡 Educational Note: A Rising Wedge often signals weakening bullish momentum. A confirmed breakdown can increase the probability of a deeper corrective move.
I expect the S&P 500 to continue its bearish trend and decline toward the Support Zone and the $7,634 level.
Trade Setup
First Take Profit(TP): $7,643
Second Take Profit(TP): $7,634
Stop Loss(SL): $7,723
Key Trading Levels: $7,670 _ $7,722
Which level do you think the S&P 500 will reach first?
🔴 $7,634
🟢 $7,723
📌 S&P 500 Analysis(SPX), 2-hour time frame.
🛑 Always use proper risk management and set a Stop Loss(SL) for every position.
🚀 If this analysis helps your trading plan, a BOOST would help more traders discover it.
SPX500) moved back below the key $7,720 trading level.The index is now trading below the Resistance Zone, while macro and geopolitical risks continue to build.
Can the S&P 500 reclaim $7,722, or is a deeper correction toward the Support Zone beginning?
Macro Outlook
Warsh’s hawkish remarks strengthened the U.S. dollar and pushed Treasury yields higher, creating additional pressure on U.S. equities.
At the same time, renewed military tensions in the Middle East remain an important risk factor. Any escalation could put further pressure on the S&P 500 and broader risk assets.
Technical Analysis
From an Elliott Wave perspective, the S&P 500 appears to have completed its corrective waves inside a Rising Wedge Pattern, suggesting that the next bearish waves could now begin.
💡 Educational Note: A Rising Wedge often signals weakening bullish momentum. A confirmed breakdown can increase the probability of a deeper corrective move.
I expect the S&P 500 to continue its bearish trend and decline toward the Support Zone and the $7,634 level.
Trade Setup
First Take Profit(TP): $7,643
Second Take Profit(TP): $7,634
Stop Loss(SL): $7,723
Key Trading Levels: $7,670 _ $7,722
Which level do you think the S&P 500 will reach first?
🔴 $7,634
🟢 $7,723
📌 S&P 500 Analysis(SPX), 2-hour time frame.
🛑 Always use proper risk management and set a Stop Loss(SL) for every position.
🚀 If this analysis helps your trading plan, a BOOST would help more traders discover it.
Trade active
Trade closed: target reached
Full Target Done($7,634)

🎁 Free Real VIP Forex and Crypto Signals. Please visit:
🔗 t.me/ProTrader_365
🔗 t.me/ProTrader_365
Disclaimer
The information and publications are not meant to be, and do not constitute, financial, investment, trading, or other types of advice or recommendations supplied or endorsed by TradingView. Read more in the Terms of Use.