
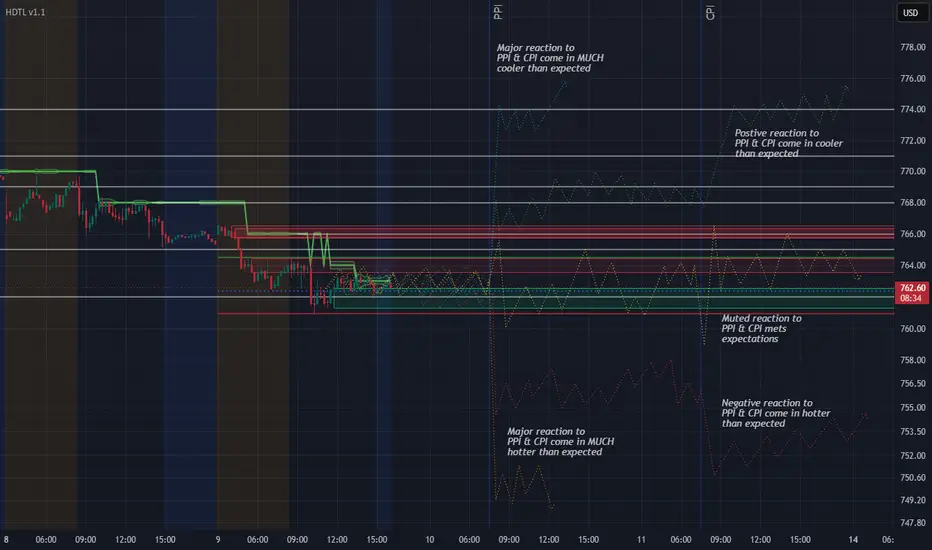
SPY has spent the last couple sessions looking exactly like what it probably is: a market waiting on inflation data.
To me, this chart is less about trying to predict every tick and more about mapping out the most likely reaction zones depending on how PPI and CPI come in.
Big picture
The market is now heading into two major inflation reports:
PPI first
CPI second
That matters because PPI can shape the tone first, but CPI is usually the report that carries more weight for equities.
Also important: these are not the only possible outcomes.
We could absolutely get:
a positive reaction to PPI and then a negative reaction to CPI
a negative reaction to PPI and then a positive reaction to CPI
a muted reaction to one and a major reaction to the other
or both numbers land close enough to expectations that the market stays messy and rotational
So this is a scenario map, not a prediction map.
What the market is watching
PPI
For PPI, the market will be focused on whether producer-side inflation starts reaccelerating or stays contained.
What I’m watching most:
Headline PPI m/m
Core PPI m/m
Any meaningful revision
Whether higher energy prices are showing up in a way that could spill into CPI later
My view is that headline PPI has upside risk because energy has clearly become a factor again.
If PPI comes in soft anyway, that would probably be taken as a relief signal.
CPI
For CPI, I care about core more than headline.
Headline can get pushed around by energy, and with oil back in focus, that can distort the first read.
But core CPI tells us more about whether inflation is actually cooling underneath the surface.
What I’m watching most:
Headline CPI m/m
Core CPI m/m
Shelter/services pressure
Whether the report confirms disinflation or reintroduces rate fear
If CPI comes in clearly cooler than expected, the market likely treats that as a green light.
If it comes in hotter, especially on core, that probably puts pressure back on equities fast.
What I expect
My base case right now is:
the market remains mostly flat / semi-flat into the data
we get more reaction trading than clean trend trading
headline numbers may have some upside risk
core numbers matter more
the first move after the release may not be the final move
In other words, I’m not interested in pretending I know the print.
I’m more interested in being prepared for how price reacts once the numbers hit.
A true strong upside squeeze probably needs the market to read the data as clearly disinflationary, especially on core — not just “good enough.”
Scenario map
1. Much cooler than expected
If PPI and/or CPI come in much cooler than expected, that is the most bullish scenario on this chart.
That is where I would expect:
a strong upside reaction
fast reclaim of higher levels
momentum names and index calls getting aggressive follow-through
the possibility of a larger squeeze instead of just a relief bounce
How I’d trade it
I would still avoid blindly chasing the first candle.
Best case is:
strong reaction
brief pullback / retest
hold above reclaimed structure
then continuation
That is the kind of move where I’d look for calls, but only if price confirms.
2. Cooler than expected, but not a huge miss
This is still bullish, just less explosive.
I would expect:
a positive reaction
less conviction
more chance of chop after the initial move
resistance still mattering
How I’d trade it
I’d want to see price accept above resistance, not just spike into it.
If it reclaims and holds, I’d look long.
If it pops and stalls, I’d be careful about chasing.
3. Roughly in line with expectations
This is the scenario where traders can get chopped up the most.
If the data is close enough to expectations, the market may not get the clean catalyst people are hoping for.
That can create:
fake moves
back-and-forth price action
failed breaks
a day where doing less is the right answer
How I’d trade it
Very selectively.
If price stays inside the mapped range and can’t build structure, I’d be perfectly fine with no trade.
Sometimes the best trade is acknowledging there isn’t a clean one.
4. Hotter than expected
If PPI and/or CPI come in hot, especially on the core side, this is the bearish scenario.
That would likely bring:
pressure on equities
renewed rate fears
weaker sentiment
downside continuation if support starts failing
How I’d trade it
I would not just smash puts into the first flush.
I’d rather see:
the initial downside reaction
a weak bounce
failure to reclaim lost structure
then continuation lower
That is where I’d be more comfortable looking for puts.
5. Split outcome scenarios
This part is important.
A lot of people act like the only possibilities are:
both bullish
or both bearish
That’s not how markets always work.
We could get:
soft PPI, hot CPI
hot PPI, soft CPI
strong initial move on one report and a complete reversal on the next
That’s why I’m not treating this chart like a single straight-line forecast.
It’s a framework.
If PPI gets a bullish reaction but CPI reverses it, then Friday becomes the real decision point.
If PPI is hot but CPI cools things back down, the market may completely reprice the week.
How I plan to trade it
My plan is simple:
No prediction worship
No blind pre-positioning
No forcing trades
Let the market show its hand first
What I want is:
the data
the reaction
the retest or failure
then the trade
If price confirms bullish acceptance, I can look for calls.
If price confirms bearish rejection, I can look for puts.
If it stays sloppy, I do nothing.
That is the entire point of preparation.
Final thought
This chart is not saying “this is exactly what will happen.”
It is saying:
if this happens, here is what I expect the market to care about
and here is how I would respond.
That’s the difference between preparation and prediction.
Preparation > Prediction

Related publications
Disclaimer
The information and publications are not meant to be, and do not constitute, financial, investment, trading, or other types of advice or recommendations supplied or endorsed by TradingView. Read more in the Terms of Use.
Related publications
Disclaimer
The information and publications are not meant to be, and do not constitute, financial, investment, trading, or other types of advice or recommendations supplied or endorsed by TradingView. Read more in the Terms of Use.