This month, something great happened. We selected one script to be featured in this monthly list and, as usual, mentioned it in the script's comment section. The next day we received a report on the script from a watchful TV member, and the script's comment section soon lit up with questions as to why the script had been selected. Problem was that, unbeknownst to us, it was too closely inspired by a script from one of the platform's respected coders. It didn't take long for us to realize our error, and so we retracted.
What went on in that script's comment section made us proud to be part of this community, and it proves without a shadow of a doubt that we are not alone, that you are with us in this endeavor to help the best rise to the top, which also involves calling out what's inappropriate when needed. It also proves that if we err, as we occasionally inevitably will, you will be there to keep a watchful eye on our slips. It is an honor for us to participate in this with you all, and we are lucky to have you because you speak up when it's needed. Together, we can do a better job than any of us could alone. From the bottom of our hearts, thank to you all—and especially to those who disagreed openly with our decision on that script.
We present you with our selection from the open-source indicators published this month on TradingView. These scripts are the ones that caught our attention while analyzing the two thousand or so scripts published each month in TradingView's Public Library, the greatest repository of indicators in the world. If we missed any, please let us know. Most of these scripts were selected on the basis of their potential to be useful in trading; others will be more useful to Pine coders.
This superb body of work constitutes unmistakable proof of the liveliness, ingenuity, and relentless creativity of the generous traders/programmers who not only give their time to write amazing scripts, but share their code with the world. Kudos to these very special humans.
Enjoy!
Stochastic Heat Map
How information is presented can be as important as the information itself. You've probably never seen Stoch like Violent shows it here.
 ═•═•═•═•═•═•═•═•═•═•═•═•═•═•═•═•═•═•═•═•═•═•═•═•═•═•═•═•═•═•═•═•═•═•═•═•═•═•═•═•═•═•═•═
Vortex MTF
melihtuna publishes an addition to the trend-identifier family with his MTF version of the Vortex indicator.
═•═•═•═•═•═•═•═•═•═•═•═•═•═•═•═•═•═•═•═•═•═•═•═•═•═•═•═•═•═•═•═•═•═•═•═•═•═•═•═•═•═•═•═
Fancy Bollinger Bands
It's a rare thing when an Nth Bollinger Bands script adds something interesting to the classic indicator. BigBitsIO does it by providing different options to select different bar types and timeframes to source their calc, and a forecasting feature.
═•═•═•═•═•═•═•═•═•═•═•═•═•═•═•═•═•═•═•═•═•═•═•═•═•═•═•═•═•═•═•═•═•═•═•═•═•═•═•═•═•═•═•═
RedK_Supply/Demand Volume Viewer v1
RedKTrader publishes a volume indicator where he uses the bar's structure to determine supply/demand volume.
═•═•═•═•═•═•═•═•═•═•═•═•═•═•═•═•═•═•═•═•═•═•═•═•═•═•═•═•═•═•═•═•═•═•═•═•═•═•═•═•═•═•═•═
Separated Moving Average - evo
Selective moving averages can reveal new aspects of price action. That is exactly what EvoCrypto does here by calculating different averages for up and down bars.
═•═•═•═•═•═•═•═•═•═•═•═•═•═•═•═•═•═•═•═•═•═•═•═•═•═•═•═•═•═•═•═•═•═•═•═•═•═•═•═•═•═•═•═
Function - Logistic Equation
The one and only Pine Maestro, RicardoSantos, gives us another one of his inventions, which models the changes in the relationship between price action and a measure of volatility.
═•═•═•═•═•═•═•═•═•═•═•═•═•═•═•═•═•═•═•═•═•═•═•═•═•═•═•═•═•═•═•═•═•═•═•═•═•═•═•═•═•═•═•═
Correlation Cycle, CorrelationAngle, Market State - John Ehlers
Scripts with lots of options allowing them to be used in different ways empower traders. midtownsk8rguy presents us with a correlation script that gives the word "study" true meaning.
═•═•═•═•═•═•═•═•═•═•═•═•═•═•═•═•═•═•═•═•═•═•═•═•═•═•═•═•═•═•═•═•═•═•═•═•═•═•═•═•═•═•═•═
US Fed Balance Sheet
NeoButane provides easy access to some of the US Fed assets available from Quandl.
═•═•═•═•═•═•═•═•═•═•═•═•═•═•═•═•═•═•═•═•═•═•═•═•═•═•═•═•═•═•═•═•═•═•═•═•═•═•═•═•═•═•═•═
Mawreez' RSI Divergence Detector
Contrary to the typical RSI divergence indicator, Mawreez quantifies the magnitude of the divergences. We also appreciated the down-to-earth and cautionary tone of his presentation.
═•═•═•═•═•═•═•═•═•═•═•═•═•═•═•═•═•═•═•═•═•═•═•═•═•═•═•═•═•═•═•═•═•═•═•═•═•═•═•═•═•═•═•═
Reminder Message (with color picker) - ApopheniaPays
There are many ways a Pine programmer can be useful to traders. ApopheniaPays finds a new one here.
═•═•═•═•═•═•═•═•═•═•═•═•═•═•═•═•═•═•═•═•═•═•═•═•═•═•═•═•═•═•═•═•═•═•═•═•═•═•═•═•═•═•═•═
Revolution Volatility Bands With Range Contraction Signal VII
MitozLakin publishes a volatility indicator which identifies contractions, so points from which price can be expected to move.
═•═•═•═•═•═•═•═•═•═•═•═•═•═•═•═•═•═•═•═•═•═•═•═•═•═•═•═•═•═•═•═•═•═•═•═•═•═•═•═•═•═•═•═
Correlation with P-Value & Confidence Interval
balipour brings correlation measurement to another level, adding an option on the calculation itself, but also putting a p-value and bands into play.
═•═•═•═•═•═•═•═•═•═•═•═•═•═•═•═•═•═•═•═•═•═•═•═•═•═•═•═•═•═•═•═•═•═•═•═•═•═•═•═•═•═•═•═
Simplistic Automatic Growth Models
RicardoSantos calls his calculations "simplistic" ) While they aren't simplistic to us, we find them really interesting.
═•═•═•═•═•═•═•═•═•═•═•═•═•═•═•═•═•═•═•═•═•═•═•═•═•═•═•═•═•═•═•═•═•═•═•═•═•═•═•═•═•═•═•═
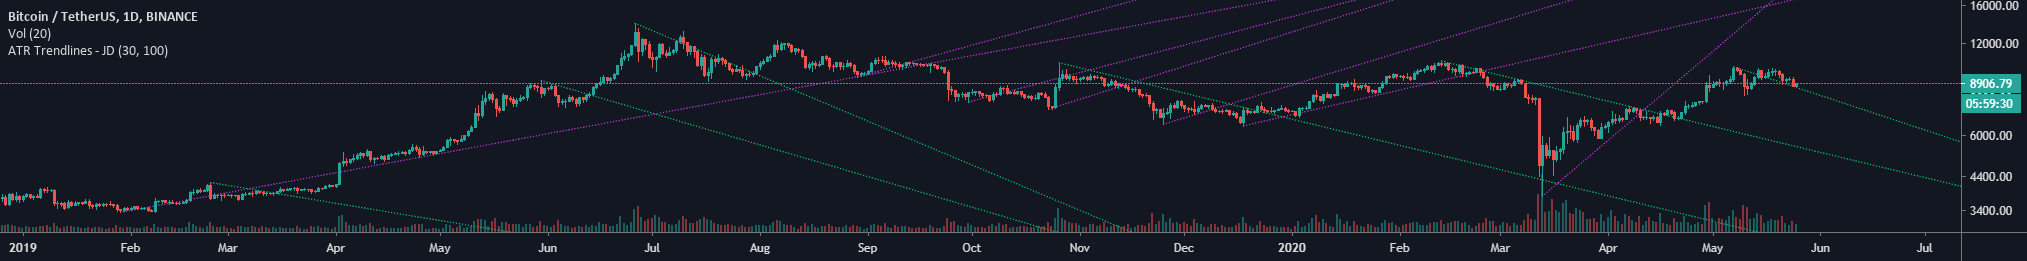
ATR Based Trendlines - JD
If one coder can be associated to trendlines on TradingView, it's this creative man. In this script, Duyck draws trend lines using ATR.
═•═•═•═•═•═•═•═•═•═•═•═•═•═•═•═•═•═•═•═•═•═•═•═•═•═•═•═•═•═•═•═•═•═•═•═•═•═•═•═•═•═•═•═
█ CODER UTILITIES
ALMA Function - Arnaud Legoux Moving Average
kurtsmock adds to the Pine coder toolbox by providing an ALMA function accepting a "series float" as its period.
═•═•═•═•═•═•═•═•═•═•═•═•═•═•═•═•═•═•═•═•═•═•═•═•═•═•═•═•═•═•═•═•═•═•═•═•═•═•═•═•═•═•═•═
Statistical Histogram with configurable bins and Data Window
Hook up any source to this script and a.tesla2018 a.tesla2018 will show you a histogram of its distribution.
═•═•═•═•═•═•═•═•═•═•═•═•═•═•═•═•═•═•═•═•═•═•═•═•═•═•═•═•═•═•═•═•═•═•═•═•═•═•═•═•═•═•═•═
security free MTF example - JD
Duyck shows how to gather HTF OHLC values without using `security()`. The technique used has the advantage of providing `high` and `low` values instantly, as they develop through the HTF's dilation of chart bars, so your script will be getting values faster than with `security()`, with the compromise that their values will update during the HTF bar, both on historical and the realtime chart bars. Far from invalidating the technique used, this method suits many HTF calcs perfectly. It's just a matter for script designers to decide if using repainting data corresponds to the requirements of their calculations. Note that unlike `security()` calls that cheat by using future data using `lookahead=barmerge.lookahead_on` and no offset of 1 on the series, Duyck's code will never use future data.
═•═•═•═•═•═•═•═•═•═•═•═•═•═•═•═•═•═•═•═•═•═•═•═•═•═•═•═•═•═•═•═•═•═•═•═•═•═•═•═•═•═•═•═
What went on in that script's comment section made us proud to be part of this community, and it proves without a shadow of a doubt that we are not alone, that you are with us in this endeavor to help the best rise to the top, which also involves calling out what's inappropriate when needed. It also proves that if we err, as we occasionally inevitably will, you will be there to keep a watchful eye on our slips. It is an honor for us to participate in this with you all, and we are lucky to have you because you speak up when it's needed. Together, we can do a better job than any of us could alone. From the bottom of our hearts, thank to you all—and especially to those who disagreed openly with our decision on that script.
We present you with our selection from the open-source indicators published this month on TradingView. These scripts are the ones that caught our attention while analyzing the two thousand or so scripts published each month in TradingView's Public Library, the greatest repository of indicators in the world. If we missed any, please let us know. Most of these scripts were selected on the basis of their potential to be useful in trading; others will be more useful to Pine coders.
This superb body of work constitutes unmistakable proof of the liveliness, ingenuity, and relentless creativity of the generous traders/programmers who not only give their time to write amazing scripts, but share their code with the world. Kudos to these very special humans.
Enjoy!
Stochastic Heat Map
How information is presented can be as important as the information itself. You've probably never seen Stoch like Violent shows it here.

Vortex MTF
melihtuna publishes an addition to the trend-identifier family with his MTF version of the Vortex indicator.

Fancy Bollinger Bands
It's a rare thing when an Nth Bollinger Bands script adds something interesting to the classic indicator. BigBitsIO does it by providing different options to select different bar types and timeframes to source their calc, and a forecasting feature.
![Fancy Bollinger Bands [BigBitsIO]](https://s3.tradingview.com/q/QL1t3Hh0_big.png)
RedK_Supply/Demand Volume Viewer v1
RedKTrader publishes a volume indicator where he uses the bar's structure to determine supply/demand volume.

Separated Moving Average - evo
Selective moving averages can reveal new aspects of price action. That is exactly what EvoCrypto does here by calculating different averages for up and down bars.

Function - Logistic Equation
The one and only Pine Maestro, RicardoSantos, gives us another one of his inventions, which models the changes in the relationship between price action and a measure of volatility.

Correlation Cycle, CorrelationAngle, Market State - John Ehlers
Scripts with lots of options allowing them to be used in different ways empower traders. midtownsk8rguy presents us with a correlation script that gives the word "study" true meaning.

US Fed Balance Sheet
NeoButane provides easy access to some of the US Fed assets available from Quandl.

Mawreez' RSI Divergence Detector
Contrary to the typical RSI divergence indicator, Mawreez quantifies the magnitude of the divergences. We also appreciated the down-to-earth and cautionary tone of his presentation.

Reminder Message (with color picker) - ApopheniaPays
There are many ways a Pine programmer can be useful to traders. ApopheniaPays finds a new one here.

Revolution Volatility Bands With Range Contraction Signal VII
MitozLakin publishes a volatility indicator which identifies contractions, so points from which price can be expected to move.

Correlation with P-Value & Confidence Interval
balipour brings correlation measurement to another level, adding an option on the calculation itself, but also putting a p-value and bands into play.
![Correlation with P-Value & Confidence Interval [pig]](https://s3.tradingview.com/a/AFYOSCoG_big.png)
Simplistic Automatic Growth Models
RicardoSantos calls his calculations "simplistic" ) While they aren't simplistic to us, we find them really interesting.
![[RS]Simplistic Automatic Growth Models](https://s3.tradingview.com/g/g7gUgU9I_big.png)
ATR Based Trendlines - JD
If one coder can be associated to trendlines on TradingView, it's this creative man. In this script, Duyck draws trend lines using ATR.
█ CODER UTILITIES
ALMA Function - Arnaud Legoux Moving Average
kurtsmock adds to the Pine coder toolbox by providing an ALMA function accepting a "series float" as its period.
![ALMA Function [FN] - Arnaud Legoux Moving Average](https://s3.tradingview.com/r/rqxaTb6E_big.png)
Statistical Histogram with configurable bins and Data Window
Hook up any source to this script and a.tesla2018 a.tesla2018 will show you a histogram of its distribution.

security free MTF example - JD
Duyck shows how to gather HTF OHLC values without using `security()`. The technique used has the advantage of providing `high` and `low` values instantly, as they develop through the HTF's dilation of chart bars, so your script will be getting values faster than with `security()`, with the compromise that their values will update during the HTF bar, both on historical and the realtime chart bars. Far from invalidating the technique used, this method suits many HTF calcs perfectly. It's just a matter for script designers to decide if using repainting data corresponds to the requirements of their calculations. Note that unlike `security()` calls that cheat by using future data using `lookahead=barmerge.lookahead_on` and no offset of 1 on the series, Duyck's code will never use future data.

Tools and ideas for all Pine coders: www.pinecoders.com
Our Pine FAQ & Code: www.pinecoders.com/faq_and_code/
Pine news broadcasts: t.me/PineCodersSquawkBox or twitter.com/PineCoders
Our Pine FAQ & Code: www.pinecoders.com/faq_and_code/
Pine news broadcasts: t.me/PineCodersSquawkBox or twitter.com/PineCoders