
Some breakouts take months. Others take years.
This one has been building for more than a decade. 👀
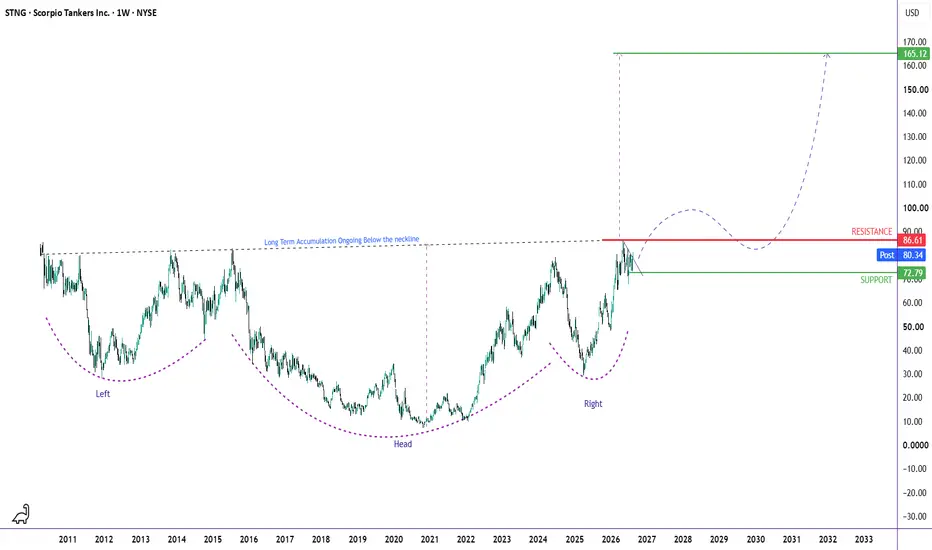
STNG has spent years forming a massive accumulation structure below the neckline of a massive Inverse HnS, repeatedly testing the same resistance without a sustained breakout.
Now price is back at the neckline again.
🔥 Why I'm watching this one
🔹 Massive long-term accumulation
🔹 Multiple historical attempts to break the neckline
🔹 Large inverse H&S-style structure developing
🔹 Price is now pressing against ~$86 resistance once again
The setup is simple:
Break $86.60 → sustain → retest → continuation. 🚀
A successful breakout and retest would be the confirmation that this multi-year accumulation has finally resolved to over 90% upside.
🎯 What I'm watching
🟢 ~$72 — key support / bullish invalidation area
🔴 $86-87 — major neckline / breakout trigger
🎯 $165 — measured long-term objective shown on the chart.
I'm not calling $165 a straight-line target. There will likely be plenty of resistance and consolidation along the way.
The first objective is simply to see $86.60 turn from resistance into support.
⚠️ High risk / high reward
This is still a speculative setup until the breakout is confirmed.
After so many failed attempts at the neckline, another rejection is absolutely possible.
But that's precisely what makes the setup interesting:
Years of accumulation + repeated resistance tests + price pressing against the neckline = a potential volatility expansion if the ceiling finally breaks.
For now:
Above $72 → bullish bias.
Above $86 - 87 + sustained retest → confirmation.
Below $72 → thesis weakens significantly.
🚢 STNG: After years of accumulation, is this finally the breakout that sticks?
Technical setup only — not financial advice.
Trade active
Testing resistance for the first time.Note
here is the breakout.
📊 Charts → 🏗️ Structure → 🎯 Probability =📖 Chart Story
⏳ Patience → 🚀Success
🎯 If this setup makes sense to you, show it some support with a Boost.
⏳ Patience → 🚀Success
🎯 If this setup makes sense to you, show it some support with a Boost.
Disclaimer
The information and publications are not meant to be, and do not constitute, financial, investment, trading, or other types of advice or recommendations supplied or endorsed by TradingView. Read more in the Terms of Use.