🔎 Overview
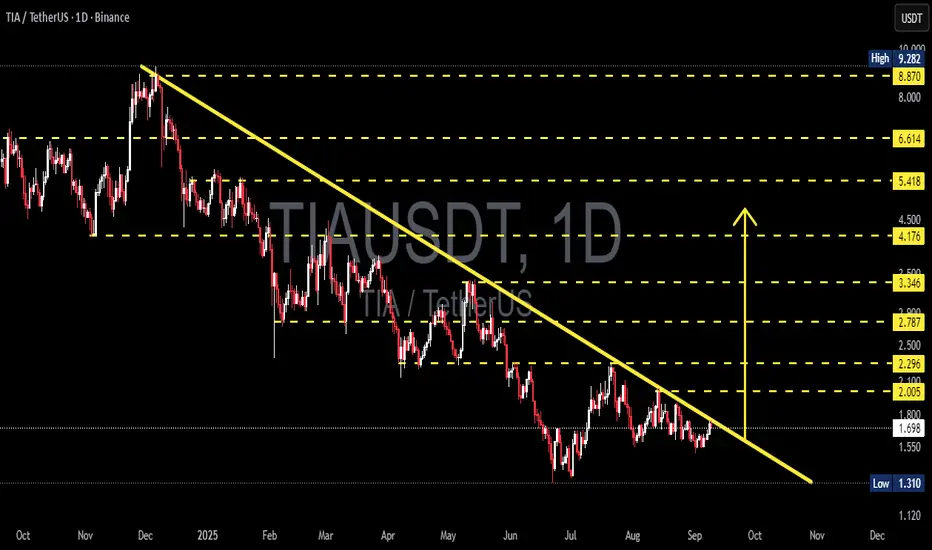
The daily chart (1D) of TIA/USDT shows that price action remains within a clear medium- to long-term downtrend. This is reflected by a series of lower highs & lower lows, all connected by the dominant descending yellow trendline.
Right now, the price is sitting at a critical crossroads — testing the trendline after months of trading below it. This is the moment that will determine whether TIA is ready to begin a bullish reversal or continue its extended bearish cycle.
---
🟢 Bullish Scenario
If TIA manages to break and close above the descending trendline with strong daily volume, the probability of a trend reversal increases significantly.
Step-by-step upside targets (based on chart levels):
2.005 USDT → first psychological resistance.
2.296 USDT → key supply zone, strong seller area.
2.787 USDT → next breakout confirmation zone.
3.346 USDT → mid-term bullish validation.
Breaking above 3.346 could open the path toward 4.176, 5.418, and higher.
Important note: a breakout without volume confirmation is often a false breakout.
---
🔴 Bearish Scenario
On the other hand, if the price fails to break the trendline and faces rejection, sellers will likely regain control.
Downside possibilities:
Price revisits 1.55 – 1.60 USDT zone.
Stronger sell pressure could drag it down to 1.310 USDT (critical support).
A breakdown below 1.310 USDT with heavy volume may trigger a capitulation wave, sending price into deeper lows.
In short: as long as price remains under the descending trendline, the overall trend stays bearish.
---
📐 Pattern & Structure
Main trend → Continuous downtrend since peak around 9.282 USDT.
Pattern → Descending trendline resistance that has rejected every rally attempt.
Critical support zone → 1.310 USDT (structural base).
Potential accumulation area → 1.3 – 1.7 USDT, seen from repeated bounces.
This structure resembles a descending channel with base-building. A breakout would shift momentum from bearish to neutral-bullish.
---
🎯 Conclusion
Bullish case → Trendline breakout + volume → upside targets at 2.0 → 2.3 → 2.7.
Bearish case → Rejection at trendline → downside toward 1.55 → 1.31.
Key focus: market’s reaction at the yellow trendline will dictate the next major move.
We are at a decision point: either TIA breaks out to start a recovery phase, or sellers take control again for another leg down.
---
#TIA #TIAUSDT #CryptoAnalysis #Altcoin #Breakout #Bearish #Bullish #ChartAnalysis #PriceAction #SwingTrade #TechnicalAnalysis #RiskManagement
✅ Get Free Signals! Join Our Telegram Channel Here: t.me/TheCryptoNuclear
✅ Twitter: twitter.com/crypto_nuclear
✅ Join Bybit : partner.bybit.com/b/nuclearvip
✅ Benefits : Lifetime Trading Fee Discount -50%
✅ Twitter: twitter.com/crypto_nuclear
✅ Join Bybit : partner.bybit.com/b/nuclearvip
✅ Benefits : Lifetime Trading Fee Discount -50%
Disclaimer
The information and publications are not meant to be, and do not constitute, financial, investment, trading, or other types of advice or recommendations supplied or endorsed by TradingView. Read more in the Terms of Use.