🚨 TLRY Trade Update – Island Reversal in Play? 🚨
I’ve been tracking Tilray (TLRY) for a while now. While the company has struggled, it’s now trading well below book value and showing some life on the charts. Here’s what I’m seeing — and how I’m positioned.
My Position:
50 contracts Jan 2026 $0.50 Calls @ $0.11
50 contracts Jan 2027 $0.50 Calls @ $0.18
Defined risk, big potential. I’m playing both the short-term breakout and the long-term value thesis.
Why I Entered When I Did:
When I watch stocks, I’m always focused on the chart, not just the price. I zoom out — monthly, weekly, daily — then zoom in: hourly, even 5–10 min on high-volume names.
On June 25th, TLRY broke above the hourly trendline. That was a key technical shift. From there, it began forming a bullish flag-like pattern — right after hitting new lows. That setup caught my attention.
I debated buying shares or options. I chose long-dated calls to fully define my risk and selected a strike that I believed could end up in the money. Ultimately, I went out to 2026 and 2027 to give the pattern — and potential catalyst flow — time to work.
Because in the end:
👉 Time is more important than price.
📊 Technical Breakdown:
1-Hour Chart:
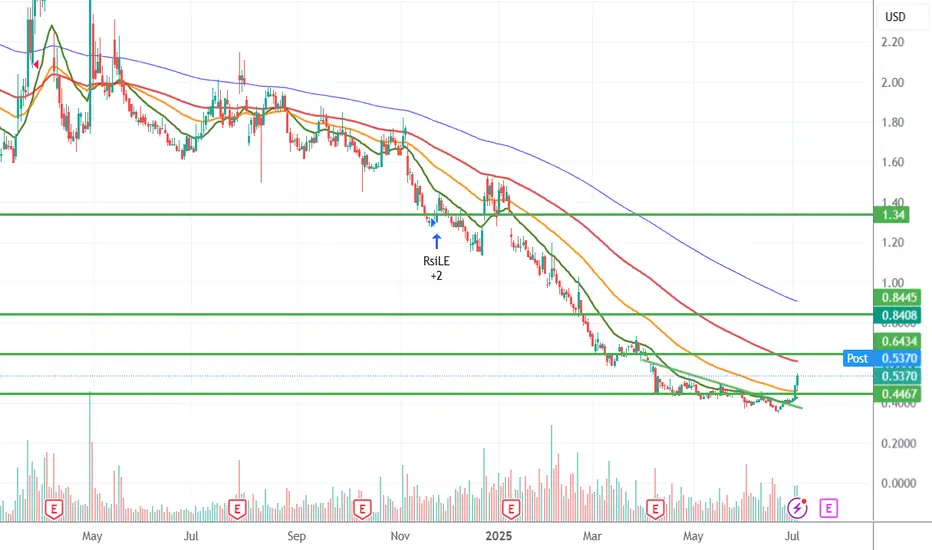
Clean breakout above $0.41–$0.44
Targeting a test of $0.64 (prior breakdown zone)
Solid momentum and volume
Daily Chart:
Potential island reversal forming
Gap fill potential to $1.34
Confluence with moving averages turning up
Fundamentals:
Trading at ~$0.48 with book value near $2.80
Market cap under $500M
Exposure to cannabis, beverages, CBD, and European growth
Possible M&A or policy tailwinds still on the table
🎯 TLRY Price Targets:
$0.64
Retest of breakdown zone
Short-term (1–2 weeks)
$0.80–$0.90
Previous consolidation/resistance
Medium-term (1–2 months)
$1.34
Gap fill zone
Long-term (3–6 months)
$2.80+
Return to book value
Tail event (6–18 months)
Risk is defined. Structure is forming. If price and fundamentals align, TLRY could have room to run. Keep an eye on volume at each level and how it handles the $0.64 test.
Let’s see if the reversal holds 🔄
P.S. Since writing this breakdown, TLRY has continued its move and closed strong. While short-term price action may vary, the core thesis remains intact: the structure, volume, and breakout levels are all part of the bigger setup I'm tracking. This is a long-term swing with defined risk, and I’ll continue to post updates as the trade unfolds.
I’ve been tracking Tilray (TLRY) for a while now. While the company has struggled, it’s now trading well below book value and showing some life on the charts. Here’s what I’m seeing — and how I’m positioned.
My Position:
50 contracts Jan 2026 $0.50 Calls @ $0.11
50 contracts Jan 2027 $0.50 Calls @ $0.18
Defined risk, big potential. I’m playing both the short-term breakout and the long-term value thesis.
Why I Entered When I Did:
When I watch stocks, I’m always focused on the chart, not just the price. I zoom out — monthly, weekly, daily — then zoom in: hourly, even 5–10 min on high-volume names.
On June 25th, TLRY broke above the hourly trendline. That was a key technical shift. From there, it began forming a bullish flag-like pattern — right after hitting new lows. That setup caught my attention.
I debated buying shares or options. I chose long-dated calls to fully define my risk and selected a strike that I believed could end up in the money. Ultimately, I went out to 2026 and 2027 to give the pattern — and potential catalyst flow — time to work.
Because in the end:
👉 Time is more important than price.
📊 Technical Breakdown:
1-Hour Chart:
Clean breakout above $0.41–$0.44
Targeting a test of $0.64 (prior breakdown zone)
Solid momentum and volume
Daily Chart:
Potential island reversal forming
Gap fill potential to $1.34
Confluence with moving averages turning up
Fundamentals:
Trading at ~$0.48 with book value near $2.80
Market cap under $500M
Exposure to cannabis, beverages, CBD, and European growth
Possible M&A or policy tailwinds still on the table
🎯 TLRY Price Targets:
$0.64
Retest of breakdown zone
Short-term (1–2 weeks)
$0.80–$0.90
Previous consolidation/resistance
Medium-term (1–2 months)
$1.34
Gap fill zone
Long-term (3–6 months)
$2.80+
Return to book value
Tail event (6–18 months)
Risk is defined. Structure is forming. If price and fundamentals align, TLRY could have room to run. Keep an eye on volume at each level and how it handles the $0.64 test.
Let’s see if the reversal holds 🔄
P.S. Since writing this breakdown, TLRY has continued its move and closed strong. While short-term price action may vary, the core thesis remains intact: the structure, volume, and breakout levels are all part of the bigger setup I'm tracking. This is a long-term swing with defined risk, and I’ll continue to post updates as the trade unfolds.
Disclaimer
The information and publications are not meant to be, and do not constitute, financial, investment, trading, or other types of advice or recommendations supplied or endorsed by TradingView. Read more in the Terms of Use.
Disclaimer
The information and publications are not meant to be, and do not constitute, financial, investment, trading, or other types of advice or recommendations supplied or endorsed by TradingView. Read more in the Terms of Use.