Whales buying back !! (3 weeks of big buy volume alert)
Hello everyone and welcome to this simple yet important
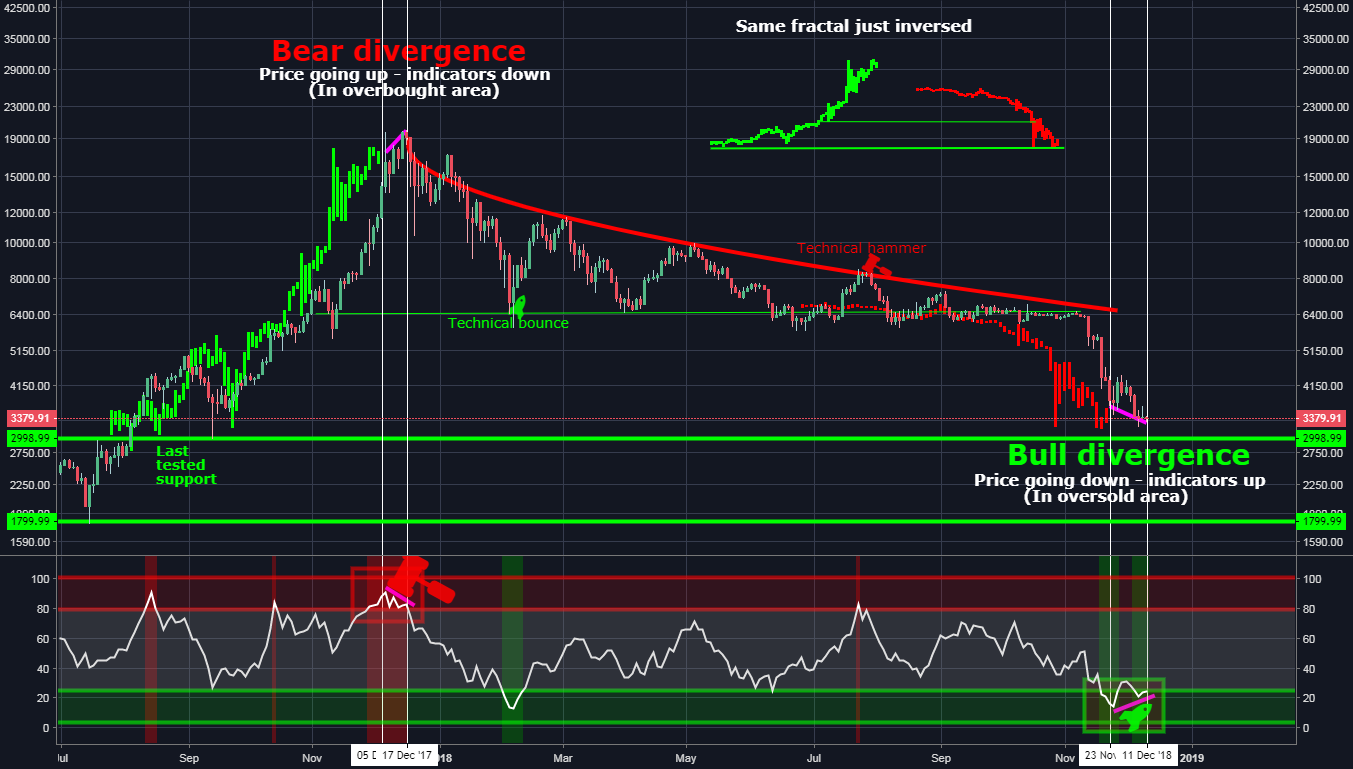
Technical Analysis of total crypto market cap based on volume and price action.
What we have visualized here is strong resistance (red line) pushing us down since BITCOIN BTCUSD
was approx. 20K USD and
BTCUSD
was approx. 20K USD and
 TOTAL
total market cap at 7xx billions.
TOTAL
total market cap at 7xx billions.
The reason why I´m watching this analysis is the BUY VOLUME in the market cap range similliar to now (Green squares)
At previous range the buy volume was far less then the actual one and we had now 3 weeks of constat buy volume (Yellow square)
on weekly chart. This is making me more comfortable to keep buying according to related idea.
The white square visualize here a FOMO when retailers jumped in based on mass media shill & got burned bad.
____________________________________________________
In related ideas you can see TA called: Bitcoin is bottom in ?
Where further informations can be found. (This reversal based on bullish divergence was spot on)
& I personally think it was best time to start buying
Have a question ? Feel free to ask.
Do you like this idea ? Likes/Follow/Sharing is highly appriciated
Wish you all great gains and nice day
Cheers
Technical Analysis of total crypto market cap based on volume and price action.
What we have visualized here is strong resistance (red line) pushing us down since BITCOIN
The reason why I´m watching this analysis is the BUY VOLUME in the market cap range similliar to now (Green squares)
At previous range the buy volume was far less then the actual one and we had now 3 weeks of constat buy volume (Yellow square)
on weekly chart. This is making me more comfortable to keep buying according to related idea.
The white square visualize here a FOMO when retailers jumped in based on mass media shill & got burned bad.
____________________________________________________
In related ideas you can see TA called: Bitcoin is bottom in ?
Where further informations can be found. (This reversal based on bullish divergence was spot on)
& I personally think it was best time to start buying
Have a question ? Feel free to ask.
Do you like this idea ? Likes/Follow/Sharing is highly appriciated
Wish you all great gains and nice day
Cheers
Comment:
Last week we whitnessed literally biggiest buy volume since the top

Comment:
We have 2 more days before we close weekly candle and volume bar
& it´s looking very bullish again so far. Watching Weekly close here will be very interesting.
& it´s looking very bullish again so far. Watching Weekly close here will be very interesting.
Comment:
Market Cap: $132 642 345 086
24h Vol: $34 950 524 143
Literally 1/4 of total market cap in daily volume
24h Vol: $34 950 524 143
Literally 1/4 of total market cap in daily volume
Comment:
Is dump upon us or is something big cooking in front of us ? Ive just realized we had this situation only few times since May 2017. What I mean is 5 weeks of buy volume in row. Everytime this happend we had a correction will it be different this time ?
Comment:
Weekly not closing yet but the buy volume passed last week
Comment:
Weekly about to close and we got biggiest buy volume this year
Comment:
Ascending / Descending triangles
Comment:
Breaking out
Comment:
Hello followers waiting for the update. Lets Review last week.
Last week we closed in red but its not that bad. If you compare sell volume which we had and if you take a look at "peak" the sell volume was almost the same but it pushed prices down almost 45% meanwhile now it took us down only 4,5% and the price looks like it broke out of the strong resistance line and seems like a support now so this week will be interesting either.
Last week we closed in red but its not that bad. If you compare sell volume which we had and if you take a look at "peak" the sell volume was almost the same but it pushed prices down almost 45% meanwhile now it took us down only 4,5% and the price looks like it broke out of the strong resistance line and seems like a support now so this week will be interesting either.
Comment:
Will be closed soon but its not yet anyways it looks more and more like breakout of this long term resistance. Moove over 150 will indicate bigger bull action. Volume is looking good
Trade closed: target reached:
Since bottom call we´re up nicely and breaking over the resistance but I think a correction is in front of us for Bitcoin but alts might keep booming. It depends on the fact if Bitcoin will correct down with spikes or sideways. If sideways = ALTcoins moon
Trade active:

Comment:

Comment:
Comment:
Comment:
Crazy buy volume but what makes me curious is that red wick which literally appeared in the chart at 21. Jun
Comment:
Revisited chart and here is update for you on lower TF. We are currently at very strong support range and buying volume is still increasing constantly. This looks like another upward moove should come soon
Comment:
Alts might have a strong run soon

Comment:
Anonymous investor teaches how to master the game towards PERSONAL GRADUAL GROWTH4FREE
IF YOU LIKE MY WORK, THEN PLEASE CONSIDER GIVING A THUMB UP TO SUPPORT ME & hit follow so you dont miss any of my new ideas.
Thanks
IF YOU LIKE MY WORK, THEN PLEASE CONSIDER GIVING A THUMB UP TO SUPPORT ME & hit follow so you dont miss any of my new ideas.
Thanks