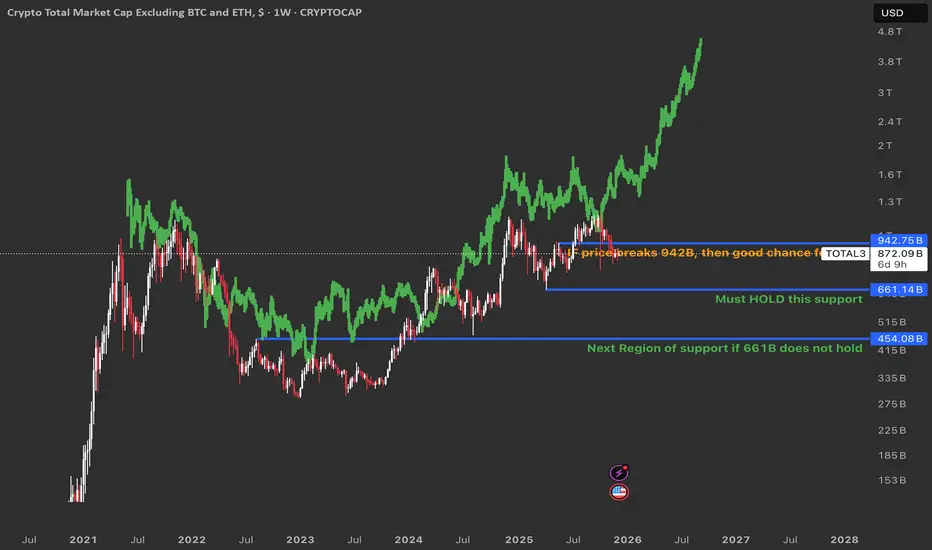
The green line is a fractal of gold’s price from 2011–2020, meaning the altcoin market is moving in a very similar pattern to how gold moved back then.
Scenario 1: Break above 942B 🚀
If TOTAL3 breaks and holds above 942B, it means buyers are strong and the market is likely ready for a big altcoin bull run.
In this case, there is a good chance the price action will continue to follow the green gold fractal, with higher highs and a long, powerful uptrend for altcoins.
Scenario 2: Lose 661B support 😬
If TOTAL3 falls below 661B, price can drop to the next major support area lower on the chart, where buyers previously stepped in.
This bearish scenario is less likely at the moment, but if it happens it would probably mean a deeper correction and a longer wait before a strong altcoin season returns.
Disclaimer
The information and publications are not meant to be, and do not constitute, financial, investment, trading, or other types of advice or recommendations supplied or endorsed by TradingView. Read more in the Terms of Use.
Disclaimer
The information and publications are not meant to be, and do not constitute, financial, investment, trading, or other types of advice or recommendations supplied or endorsed by TradingView. Read more in the Terms of Use.