The Idea
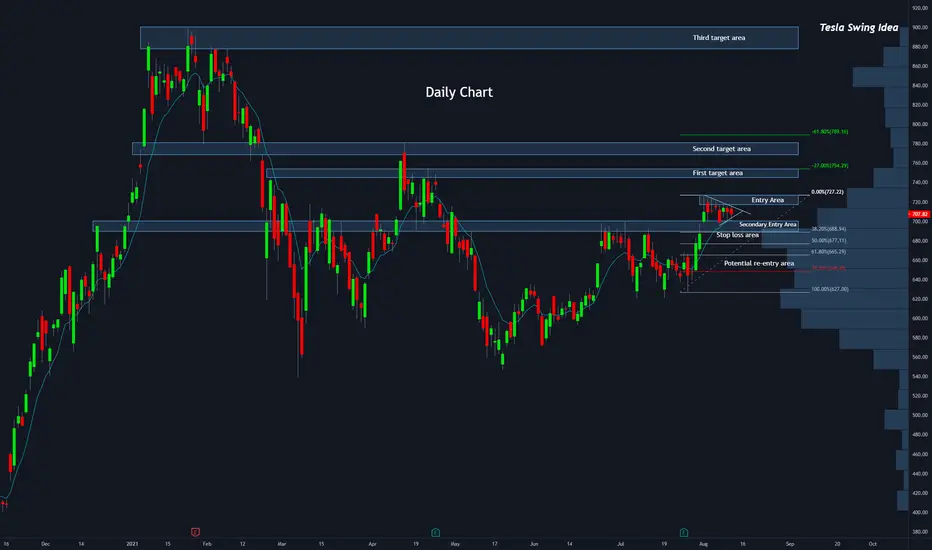
Enter on the break of the symmetrical triangle at ~718-728. The exact entry should be determined using intra-day price action in these next few days.
Potential stop loss 1: Under ~700 (break of triangle and entry into demand zone)
Potential stop loss 2: Under ~690 (break of demand zone + break of 38.2% Fibonacci level)
Potential target 1: ~750 (supply zone + 27% Fibonacci level)
Potential target 2: ~780 (supply zone + 61.8% Fibonacci level)
Potential target 3: All time high +
Reasoning
1) Broke, retested and held critical zone (supported by both key price levels as well as VPVR).
2) Has began respecting the 9 EMA closely.
3) Created a Symmetrical Triangle formation indicating an explosive move is on the horizon.
Notes
- If the price breaks the triangle to the downside but the demand zone holds (creating a Bull Flag/Falling Wedge), I would personally still consider the play to be valid. In this scenario, I would either:
- If the price breaks down through the demand zone, I would exit and potentially re-enter at the 61.8% - 78.6% Fibonacci levels.
Here's the Symmetrical Triangle zoomed in on the 2 hour chart

Enter on the break of the symmetrical triangle at ~718-728. The exact entry should be determined using intra-day price action in these next few days.
Potential stop loss 1: Under ~700 (break of triangle and entry into demand zone)
Potential stop loss 2: Under ~690 (break of demand zone + break of 38.2% Fibonacci level)
Potential target 1: ~750 (supply zone + 27% Fibonacci level)
Potential target 2: ~780 (supply zone + 61.8% Fibonacci level)
Potential target 3: All time high +
Reasoning
1) Broke, retested and held critical zone (supported by both key price levels as well as VPVR).
2) Has began respecting the 9 EMA closely.
3) Created a Symmetrical Triangle formation indicating an explosive move is on the horizon.
Notes
- If the price breaks the triangle to the downside but the demand zone holds (creating a Bull Flag/Falling Wedge), I would personally still consider the play to be valid. In this scenario, I would either:
- Enter once the price enters the original planned entry area (better win % but lower R:R play).
- Enter at or in the demand zone ("Secondary Entry Area") once it shows confirmation that it still wants to hold (lower win % but higher R:R play).
- If the price breaks down through the demand zone, I would exit and potentially re-enter at the 61.8% - 78.6% Fibonacci levels.
Here's the Symmetrical Triangle zoomed in on the 2 hour chart
Disclaimer
The information and publications are not meant to be, and do not constitute, financial, investment, trading, or other types of advice or recommendations supplied or endorsed by TradingView. Read more in the Terms of Use.
Disclaimer
The information and publications are not meant to be, and do not constitute, financial, investment, trading, or other types of advice or recommendations supplied or endorsed by TradingView. Read more in the Terms of Use.