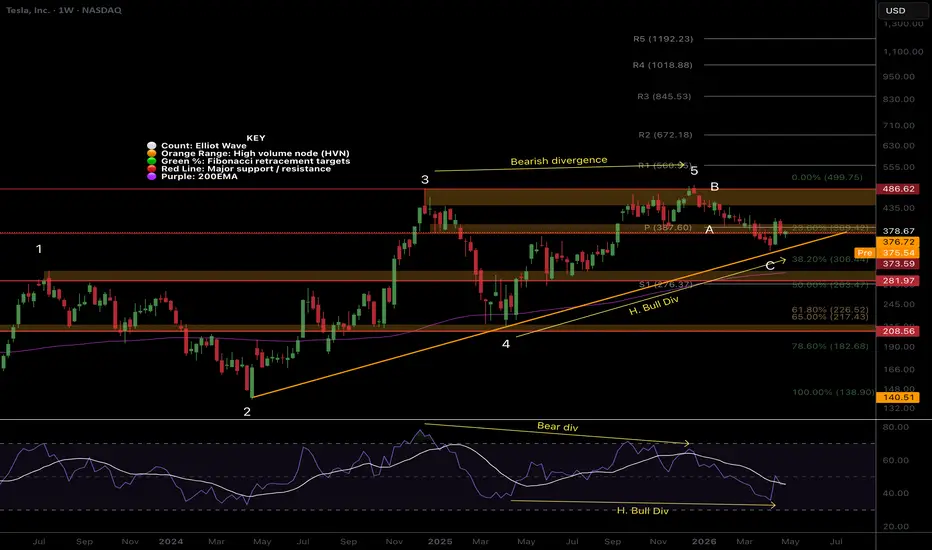
 TSLA completed 5 waves up in a leading diagonal, and is making its correction down in wave 2, finding support at the trendline just below the weekly pivot. The structure is bullish/ The weekly 200EMA is the downside target, sitting above the High Volume Node, S1 pivot and 0.5 Fibonacci retracement. A high confluence terminal area.
📈 Weekly RSI has unconfirmed hidden bullish divergence
👉 Analysis is invalidated above wave 5

Related publications
Disclaimer
The information and publications are not meant to be, and do not constitute, financial, investment, trading, or other types of advice or recommendations supplied or endorsed by TradingView. Read more in the Terms of Use.
Related publications
Disclaimer
The information and publications are not meant to be, and do not constitute, financial, investment, trading, or other types of advice or recommendations supplied or endorsed by TradingView. Read more in the Terms of Use.