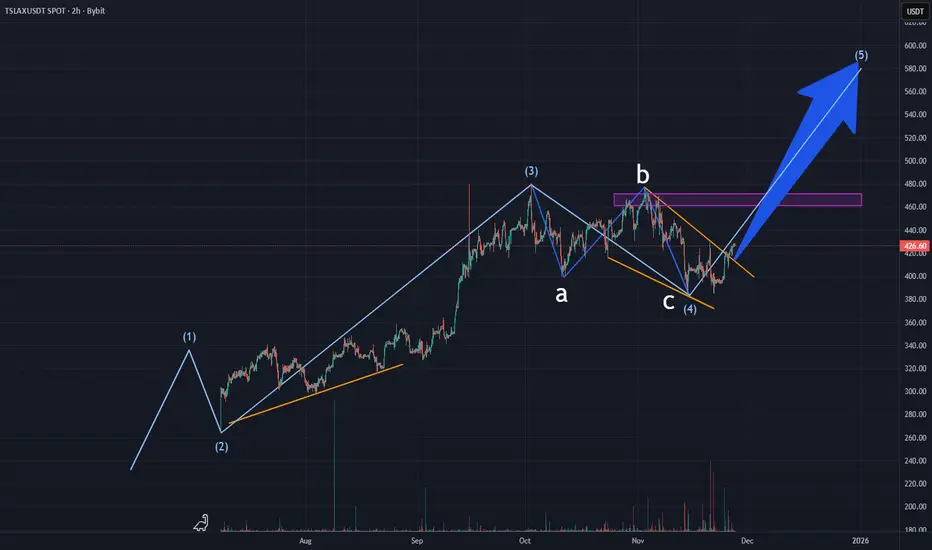
Tesla (TSLAX, TSLA) is forming its 5th full wave of growth according to Elliott Wave Theory.
Unfortunately, the chart on TradingView is incomplete; it was created based on other sources and then transferred to TV.
ABC corrective waves (marked in blue) were most likely formed.
Above, we also see an area of liquidity that is more likely to be taken.
According to wave 3, we can predict the length of wave 5 to be around 20%.
As is well known, stock movements last somewhat longer than cryptocurrencies, and this should be kept in mind.
If the price forms a low lower than the start of wave 4, this wave structure will be considered broken, and the price may move downward.
Full breakdown on website
Disclaimer
The information and publications are not meant to be, and do not constitute, financial, investment, trading, or other types of advice or recommendations supplied or endorsed by TradingView. Read more in the Terms of Use.
Disclaimer
The information and publications are not meant to be, and do not constitute, financial, investment, trading, or other types of advice or recommendations supplied or endorsed by TradingView. Read more in the Terms of Use.