
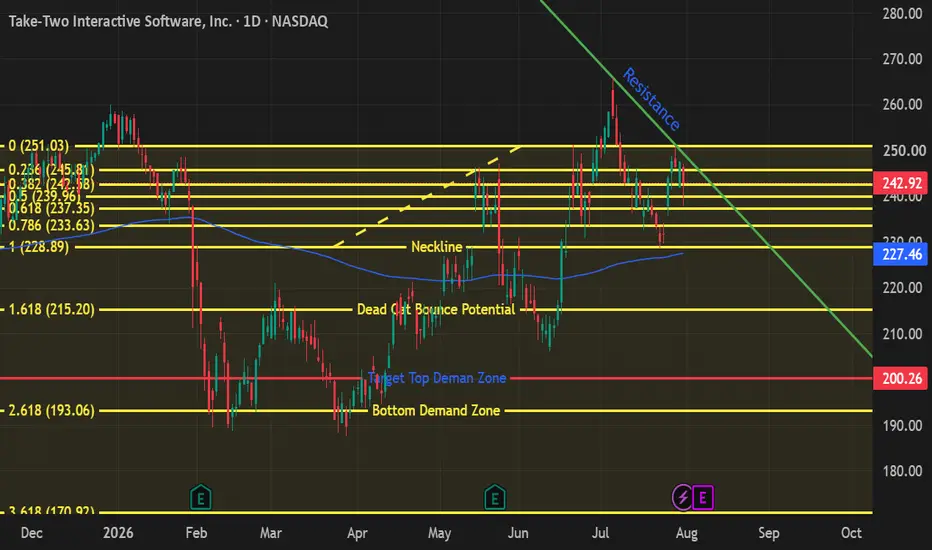
A 17.6% decline sounds aggressive while TTWO is still trading in the $240s, but the chart has already started building the sequence that could make it reasonable. The real decision sits inside the crowded support structure between $242.18 and $228.89.
The rejection matters more than the distance
TTWO reached approximately $262 in July and immediately gave the move back. Price lost $251.03, recovered toward $248, and ran directly into the descending resistance line.
That second attempt could not retake the previous high. It produced a lower high underneath resistance, followed by another rejection. That behavior creates the possibility of a developing right shoulder, with $228.89 acting as the neckline.
The pattern is not complete yet. Price remains above the neckline, and the latest candle traded down to $237.96 before recovering to $242.92. Buyers are still responding inside support. The downside thesis depends on those responses becoming weaker each time price tests the area.
That distinction matters. I am not treating $200.26 as a prediction based on one red candle. I am watching a sequence in which price failed near $262, failed again beneath $251.03, and is now pressuring the support structure underneath it.
Why $200.26 is a logical destination
The target is approximately 17.6% below the visible $242.92 close. That sounds substantial until the chart is divided into the levels price would have to lose along the way.
The first battlefield runs from $242.18 through $237.35. Price has repeatedly moved through this area, which tells me it can create reactions without necessarily stopping the larger move. Sustained trading beneath $237.35 would expose $233.63.
Below that sits the real structural test: the $228.89 neckline and the rising moving average near $227.46. This is where I would expect buyers to make their strongest stand. It combines visible structure, a prior breakout area, and dynamic support.
If TTWO loses that cluster and cannot reclaim it, the chart changes character. The market would no longer be defending the structure that supported the recovery from June. It would also complete the neckline failure beneath the developing reversal pattern.
That opens the route toward $215.20.
A bounce around $215.20 would make sense because it is the next clearly marked extension and a previous reaction area. That bounce would not automatically repair the chart. If price rallies from $215.20 and fails beneath the broken $228.89–$233.63 region, the former support would begin functioning as resistance.
That failed recovery would make $200.26 the next probable destination.
The target sits at the top of the chart’s larger demand zone, close to the area where TTWO previously based before its spring expansion. The lower boundary is marked near $193.06. My thesis only requires price to reach the upper edge of that zone; it does not depend on TTWO collapsing through the entire structure.
The route I’m watching
The probable sequence is:
Failure to regain the descending resistance line and $251.03
Acceptance below $242.18
Weakening reactions around $239.62 and $237.35
Loss of $233.63
Breakdown and failed reclaim of the $228.89–$227.46 neckline area
Reaction near $215.20
Continuation into the $200.26 demand-zone target
TTWO reports fiscal first-quarter results before the market opens on August 7. That event can compress several stages of this route into one gap, or temporarily erase the clean technical sequence. The levels still matter, but earnings can change how price travels between them.
What changes the present route
A sustained reclaim of $251.03 and the descending resistance line would damage the immediate bearish sequence. Price would be recovering the level that rejected the latest rally and would have another opportunity to attack the July high.
A break above approximately $262 would invalidate the current lower-high structure altogether. The $200.26 destination could remain relevant later, but this specific route would no longer be the reason.
Until TTWO proves it can reclaim $251.03, the chart remains vulnerable. Most traders will focus on whether $240 holds; the larger move will be decided by what happens after $228.89 stops holding.
Direction: Short thesis
Time horizon: Multi-week swing
Key levels: $251.03, $242.18, $233.63, $228.89–$227.46, $215.20, $200.26 target

Toni Evanu
Disclaimer
The information and publications are not meant to be, and do not constitute, financial, investment, trading, or other types of advice or recommendations supplied or endorsed by TradingView. Read more in the Terms of Use.
Toni Evanu
Disclaimer
The information and publications are not meant to be, and do not constitute, financial, investment, trading, or other types of advice or recommendations supplied or endorsed by TradingView. Read more in the Terms of Use.