
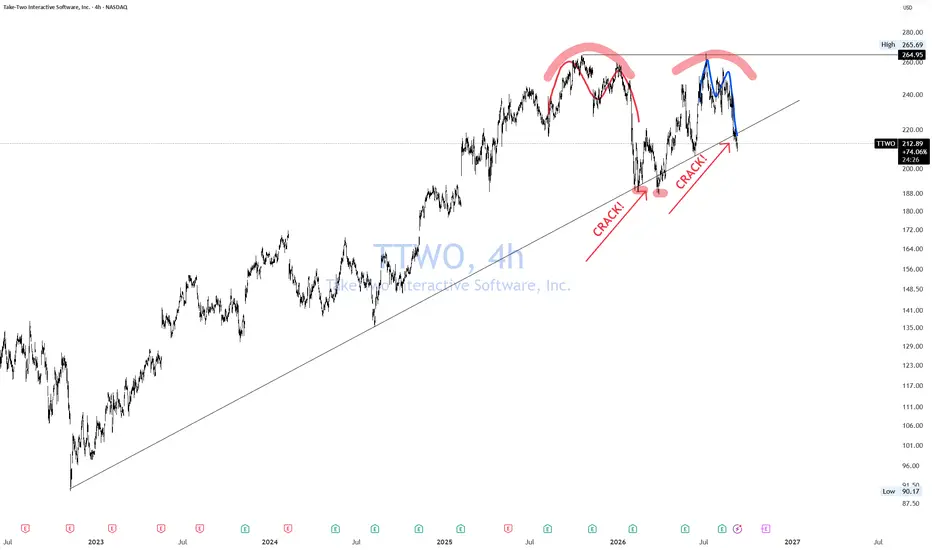
Nice topping M pattern that led to the first CRACK! in the chart after three years. What followed was a test of previous highs, with another M pattern forming a double top. During all that time, we've seen multiple cracks and 1 lower low.
Charts historically don't behave like this. Normally they break correct and then decide if they should rise again or collapse.
I attribute this type of chart behavior to the parabolic move of stocks overall.

When (not IF) Markets return to normal price action, believe me, you will see chart patterns behave very differently.
If you enjoy the work: 👉 Drop a solid comment. Let’s push it to 7,000 and keep building a community grounded in raw truth, not hype.
Charts historically don't behave like this. Normally they break correct and then decide if they should rise again or collapse.
I attribute this type of chart behavior to the parabolic move of stocks overall.
When (not IF) Markets return to normal price action, believe me, you will see chart patterns behave very differently.
If you enjoy the work: 👉 Drop a solid comment. Let’s push it to 7,000 and keep building a community grounded in raw truth, not hype.

Real Macro Economic Investing
patreon.com/Realmacro
patreon.com/Realmacro
Disclaimer
The information and publications are not meant to be, and do not constitute, financial, investment, trading, or other types of advice or recommendations supplied or endorsed by TradingView. Read more in the Terms of Use.