
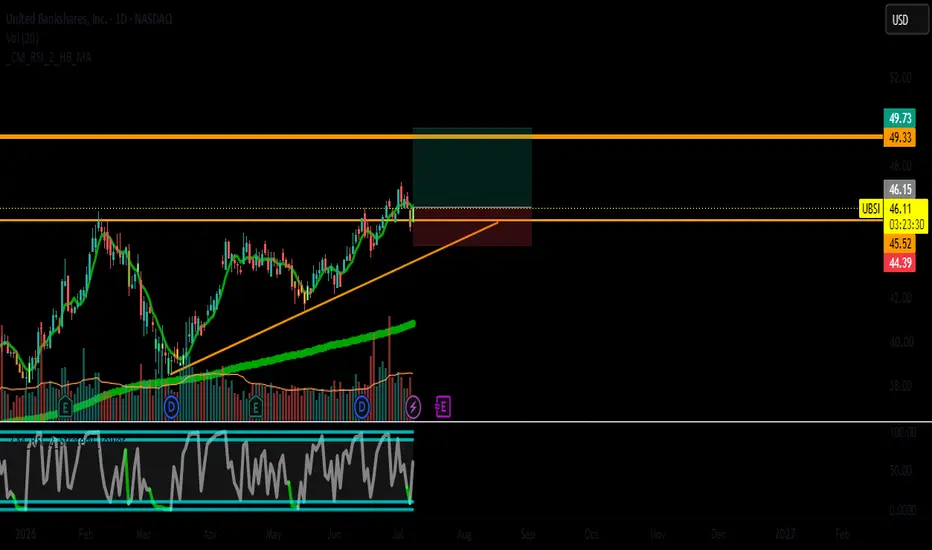
⚙️ Trade Configuration
Concept Level
Entry $46.12
Stop Loss (SL) $44.39 (-3.75%)
Take Profit (TP) $49.73 (+7.83%)
Risk/Reward Ratio ~2.1 : 1
Estimated Probability 68% – 72%
🔍 Company Overview
United Bankshares, Inc. (UBSI) is a regional bank holding company headquartered in Charleston, West Virginia, operating through its subsidiary United Bank. With approximately 2,694 employees and a market capitalization of $6.23 billion, UBSI is a "Dividend Aristocrat" having increased its dividend for 52 consecutive years — a testament to its financial discipline and commitment to shareholders.
📊 Fundamental Analysis
Q1 2026 Results – Strong Beat:
Net Income: $124.2 million, up +47.3% year-over-year
EPS: $0.89 GAAP; **$0.87** excluding securities gains, beating Raymond James and consensus estimates of $0.85
Revenue: $449.99 million
Key Catalysts:
Raymond James Reiterates Outperform (July 1, 2026): Analyst Steve Moss raised the price target to **$50** from $49, maintaining an Outperform rating — the most bullish call on the street. The beat was driven mainly by balance sheet expansion and lower expenses.
52-Year Dividend Streak: The company has increased its dividend for 52 consecutive years. The annual dividend is $1.52 per share, with a current yield of approximately 3.24% – 3.45%. The most recent ex-dividend date was June 12, 2026, with payment made on July 1, 2026.
Share Buyback Completed: UBSI has fully executed its previously announced share repurchase program.
Valuation:
Trailing P/E: 12.68 | Forward P/E: 12.42
P/B Ratio: 1.14
ROE: 9.34% | ROA: 1.52%
PEG Ratio: 2.07
Beta: 0.73 (lower volatility than the market average)
Analyst Consensus:
Consensus Rating: Hold (2 Buy, 4 Hold)
Average Price Target: **$47.83** (range: $45 – $50)
Raymond James Target: $50 (most bullish)
Piper Sandler Target: $47 (Buy)
Earnings Catalyst: The next earnings report is estimated for Thursday, July 23, 2026, before market open, with EPS consensus of $0.88. This represents a potential catalyst for the stock.
📈 Technical Analysis
Recent Price Action:
Previous Close (July 8): $45.30
52-Week Range: ~$38.00 – $46.50
52-Week Price Change: +20.43%
From our system – UBSI Profile:
Fundamental Score 4.5 / 5 (maximum)
Technical Score 3.0 / 3 (perfect)
Score Pro 8.5 (Strong Buy)
Key Technical Levels:
Support (SL): $44.39 – below the 50-day moving average ($44.10) and recent support zone
Immediate Resistance: $47.83 (average analyst target) → $49.73 (our TP)
Major Resistance: $50.00 (Raymond James target and psychological level)
200-Day Moving Average: $40.80 (well below current price, confirming long-term uptrend)
Technical Indicators:
Overall Technical Sentiment: Strong Buy – 15 bullish signals vs. 4 bearish
Moving Average Consensus: Strong Buy – 12 bullish signals, 0 neutral, 0 bearish
RSI (14): 51.50 – Neutral, room to run higher
Price Position: Trading well above the 50-day MA ($44.10) and 200-day MA ($40.80), confirming bullish momentum
MACD: 0.54 – Positive, though showing some caution
Interpretation:
The stock has appreciated +20.43% over the past 52 weeks and is approaching its 52-week highs
The recent pullback from higher levels offers a potential re-entry opportunity near the $46 level
With a beta of just 0.73, UBSI offers lower volatility than the market average — a defensive quality in uncertain times
The strong technical consensus ("Strong Buy") across multiple indicators suggests the uptrend remains intact
🛡️ Risk Management
Position sizing: Risk no more than 1.5% – 2% of total capital.
Risk per trade: Entry – SL = $1.73 per share (-3.75%).
Trailing stop: Once price breaks above $48.50, consider moving SL to breakeven.
Partial profit booking: Consider closing 50% at $48.50** and let the rest ride with a trailing stop toward **$49.73.
⚠️ Key Risks to Monitor
Macro Headwinds: Rising bond yields and Federal Reserve rate hike fears have pressured regional bank stocks, with investors rotating out of the sector. The sell-off reflects macro fears rather than company-specific setbacks.
Interest Rate Sensitivity: As a regional bank, UBSI's results have swung sharply in past cycles and the business remains highly exposed to interest-rate and credit conditions.
Earnings Risk: The upcoming Q2 2026 earnings (July 23) could trigger volatility if results miss expectations.
Analyst Divergence: While Raymond James is bullish ($50 target), the consensus rating is "Hold" with an average target of $47.83.
Sector Rotation: Any continued rotation out of financials could pressure the stock further in the short term.
🧠 Final Thought
United Bankshares combines solid fundamentals (4.5/5 Score), a Raymond James Outperform rating with a $50 price target, a 52-year dividend growth streak with a ~3.4% yield, and a Strong Buy technical consensus. The upcoming Q2 2026 earnings on July 23 could serve as a catalyst for the stock.
The trade offers a ~2.1:1 risk/reward ratio with a well-defined stop loss at **$44.39** — just below the 50-day moving average ($44.10). The TP of $49.73** sits just below the Raymond James target of **$50 and within the analyst target range ($45 – $50), making it realistically achievable.
Ideal for: Swing trading and position trading with a 2 to 8-week horizon, particularly for income-oriented investors seeking a high-quality regional bank with a stable dividend.
📝 This analysis is for educational and informational purposes only and does not constitute financial advice. Always perform your own due diligence and assess your risk tolerance before entering any trade.
Concept Level
Entry $46.12
Stop Loss (SL) $44.39 (-3.75%)
Take Profit (TP) $49.73 (+7.83%)
Risk/Reward Ratio ~2.1 : 1
Estimated Probability 68% – 72%
🔍 Company Overview
United Bankshares, Inc. (UBSI) is a regional bank holding company headquartered in Charleston, West Virginia, operating through its subsidiary United Bank. With approximately 2,694 employees and a market capitalization of $6.23 billion, UBSI is a "Dividend Aristocrat" having increased its dividend for 52 consecutive years — a testament to its financial discipline and commitment to shareholders.
📊 Fundamental Analysis
Q1 2026 Results – Strong Beat:
Net Income: $124.2 million, up +47.3% year-over-year
EPS: $0.89 GAAP; **$0.87** excluding securities gains, beating Raymond James and consensus estimates of $0.85
Revenue: $449.99 million
Key Catalysts:
Raymond James Reiterates Outperform (July 1, 2026): Analyst Steve Moss raised the price target to **$50** from $49, maintaining an Outperform rating — the most bullish call on the street. The beat was driven mainly by balance sheet expansion and lower expenses.
52-Year Dividend Streak: The company has increased its dividend for 52 consecutive years. The annual dividend is $1.52 per share, with a current yield of approximately 3.24% – 3.45%. The most recent ex-dividend date was June 12, 2026, with payment made on July 1, 2026.
Share Buyback Completed: UBSI has fully executed its previously announced share repurchase program.
Valuation:
Trailing P/E: 12.68 | Forward P/E: 12.42
P/B Ratio: 1.14
ROE: 9.34% | ROA: 1.52%
PEG Ratio: 2.07
Beta: 0.73 (lower volatility than the market average)
Analyst Consensus:
Consensus Rating: Hold (2 Buy, 4 Hold)
Average Price Target: **$47.83** (range: $45 – $50)
Raymond James Target: $50 (most bullish)
Piper Sandler Target: $47 (Buy)
Earnings Catalyst: The next earnings report is estimated for Thursday, July 23, 2026, before market open, with EPS consensus of $0.88. This represents a potential catalyst for the stock.
📈 Technical Analysis
Recent Price Action:
Previous Close (July 8): $45.30
52-Week Range: ~$38.00 – $46.50
52-Week Price Change: +20.43%
From our system – UBSI Profile:
Fundamental Score 4.5 / 5 (maximum)
Technical Score 3.0 / 3 (perfect)
Score Pro 8.5 (Strong Buy)
Key Technical Levels:
Support (SL): $44.39 – below the 50-day moving average ($44.10) and recent support zone
Immediate Resistance: $47.83 (average analyst target) → $49.73 (our TP)
Major Resistance: $50.00 (Raymond James target and psychological level)
200-Day Moving Average: $40.80 (well below current price, confirming long-term uptrend)
Technical Indicators:
Overall Technical Sentiment: Strong Buy – 15 bullish signals vs. 4 bearish
Moving Average Consensus: Strong Buy – 12 bullish signals, 0 neutral, 0 bearish
RSI (14): 51.50 – Neutral, room to run higher
Price Position: Trading well above the 50-day MA ($44.10) and 200-day MA ($40.80), confirming bullish momentum
MACD: 0.54 – Positive, though showing some caution
Interpretation:
The stock has appreciated +20.43% over the past 52 weeks and is approaching its 52-week highs
The recent pullback from higher levels offers a potential re-entry opportunity near the $46 level
With a beta of just 0.73, UBSI offers lower volatility than the market average — a defensive quality in uncertain times
The strong technical consensus ("Strong Buy") across multiple indicators suggests the uptrend remains intact
🛡️ Risk Management
Position sizing: Risk no more than 1.5% – 2% of total capital.
Risk per trade: Entry – SL = $1.73 per share (-3.75%).
Trailing stop: Once price breaks above $48.50, consider moving SL to breakeven.
Partial profit booking: Consider closing 50% at $48.50** and let the rest ride with a trailing stop toward **$49.73.
⚠️ Key Risks to Monitor
Macro Headwinds: Rising bond yields and Federal Reserve rate hike fears have pressured regional bank stocks, with investors rotating out of the sector. The sell-off reflects macro fears rather than company-specific setbacks.
Interest Rate Sensitivity: As a regional bank, UBSI's results have swung sharply in past cycles and the business remains highly exposed to interest-rate and credit conditions.
Earnings Risk: The upcoming Q2 2026 earnings (July 23) could trigger volatility if results miss expectations.
Analyst Divergence: While Raymond James is bullish ($50 target), the consensus rating is "Hold" with an average target of $47.83.
Sector Rotation: Any continued rotation out of financials could pressure the stock further in the short term.
🧠 Final Thought
United Bankshares combines solid fundamentals (4.5/5 Score), a Raymond James Outperform rating with a $50 price target, a 52-year dividend growth streak with a ~3.4% yield, and a Strong Buy technical consensus. The upcoming Q2 2026 earnings on July 23 could serve as a catalyst for the stock.
The trade offers a ~2.1:1 risk/reward ratio with a well-defined stop loss at **$44.39** — just below the 50-day moving average ($44.10). The TP of $49.73** sits just below the Raymond James target of **$50 and within the analyst target range ($45 – $50), making it realistically achievable.
Ideal for: Swing trading and position trading with a 2 to 8-week horizon, particularly for income-oriented investors seeking a high-quality regional bank with a stable dividend.
📝 This analysis is for educational and informational purposes only and does not constitute financial advice. Always perform your own due diligence and assess your risk tolerance before entering any trade.

Disclaimer
The information and publications are not meant to be, and do not constitute, financial, investment, trading, or other types of advice or recommendations supplied or endorsed by TradingView. Read more in the Terms of Use.
Disclaimer
The information and publications are not meant to be, and do not constitute, financial, investment, trading, or other types of advice or recommendations supplied or endorsed by TradingView. Read more in the Terms of Use.