
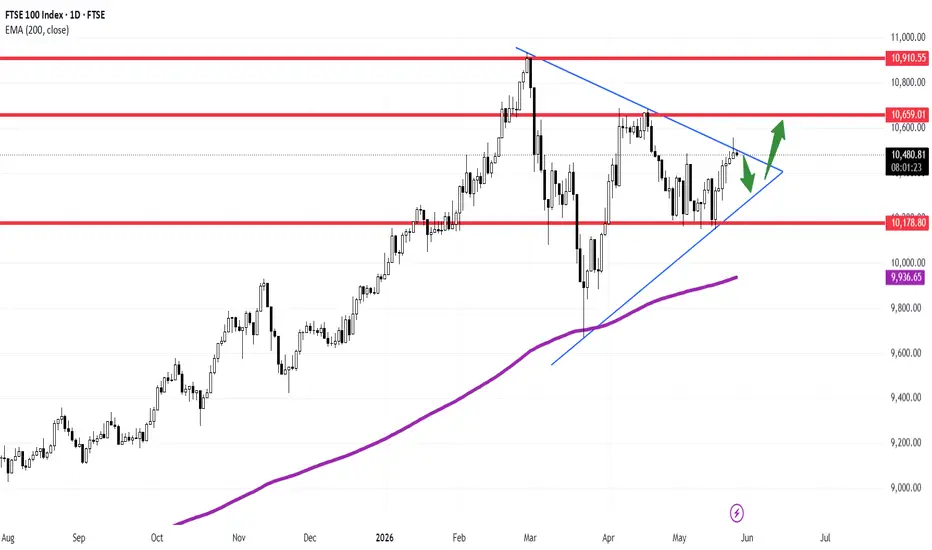
The UK 100 (FTSE 100 Index) is presenting a highly textbook technical structure on the Daily Chart, consolidating within a large Symmetrical Triangle pattern.
As a core benchmark for European markets, tracking these macro compressions provides excellent high-probability setups for position and swing traders.
### Key Technical Insights:
* **The Symmetrical Triangle Compression:** Following a powerful long-term bull run, the index has entered a healthy consolidation phase. The price has captured liquidity at the lower ascending trendline and is now actively testing the upper descending resistance line.
* **Key Overhead Resistance Levels:** A successful breakout faces immediate horizontal resistance at the **10,635 level** (previous structure high). Beyond that, the ultimate macro target sits at the major historical peak of **10,910**.
* **The EMA 200 Baseline:** The long-term trend remains firmly bullish, beautifully supported by the rising 200-Period Exponential Moving Average (purple line currently climbing near 9,936), keeping the structural buyer bias intact.
### Strategic Scenario (The Breakout Sequence):
The green arrows on the chart illustrate the expected technical behavior as liquidity dries up near the apex:
1. **Short-Term Rejection/Retest (First Arrow):** A minor, healthy intraday pullback from the upper trendline to retest internal local support within the triangle structure.
2. **The Bullish Expansion (Second Arrow):** A decisive daily close above the descending trendline, triggering momentum to attack the 10,635 resistance barrier and opening the doors for a macro continuation rally toward 10,910.
### Execution Takeaway:
Watch the daily close carefully. A confirmed breakout from this compression pattern will offer a highly favorable risk-to-reward ratio for long positions, using the triangle's lower support line for risk definition.
---
📊 **ProData Chart** | By Rogerio Zaglia
*12+ years of daily global market technical analysis.*
⚠️ **Disclaimer:** This analysis is for educational and informational purposes only. It does not constitute financial advice or an investment recommendation. Past performance is not indicative of future results.

Disclaimer
The information and publications are not meant to be, and do not constitute, financial, investment, trading, or other types of advice or recommendations supplied or endorsed by TradingView. Read more in the Terms of Use.
Disclaimer
The information and publications are not meant to be, and do not constitute, financial, investment, trading, or other types of advice or recommendations supplied or endorsed by TradingView. Read more in the Terms of Use.