Hello, gentlemen ⚫️ | comrades 🔴 | colleagues 🔵
After a prolonged silence and at the end of the year, I return, as usual, to dissect the markets and publish new ideas on my favorite platform, TradingView. Before you is an updated forecast for long-term US bonds targeting the pivotal year 2027 and a strategic horizon stretching up to 2030–2035.
To keep your brain from boiling over, the material is structurally divided into three logical blocks:
1️⃣ Infographics
2️⃣ Breakdown of the US10Y chart
3️⃣ “Conspiracy Theory”
Today, we are leaving the safe territory of an illusory, cozy cardboard reality. The very one that the mass media carefully glues together daily for the docile herd. We are stepping onto the uncomfortable, wild lands of common sense and the pursuit of truth. We will analyze what categorically fails to fit into the official interpretation of global processes — everything that the mainstream media, legions of sellout bloggers, and the propaganda-drugged crowd squeamishly brand as "conspiracy theory".
Right now, we are going to lay down the bitter truth, and very few will like it. But we aren't on a romantic date here, and the author has no intention of selling anything to anyone or any desire to be liked. Quite the opposite: this arrogant, daring, and at times toxic tone was chosen completely deliberately. My primary goal right now is to scare away unprepared, fragile minds who walked into here looking for easy signals and pretty fairy tales. If you are afraid to look reality in the eye, close the tab. Ignorance is bliss.
So, fasten your seatbelts. Let's go!
________________________________________
1️⃣ Infographics
________________________________________
Alright, before moving on to the main US10Y chart, let's first take a look at the big picture overall, backed up by dry, uncompromising numbers. While official propaganda and the financial
media MADD can feed the crowd pretty fairy tales for years about the "unsinkability" of the US economy, charts, regulator balance sheets, and dry US Treasury capital flow reports cannot lie. Below is a detailed anatomical breakdown of ten key infographics from the open internet, which visually and with mathematical rigor document the process of dismantling the old global financial system.
Before you is the actual evidentiary basis for everything written about on this channel. We will systematically analyze the historic breakdown of the 40-year supercycle of cheap money, the catastrophic surge in the cost of servicing the $40 trillion US national debt, the quiet yet massive escape of BRICS central banks from the hegemon's toxic bonds, and the forced offshore disguise of the dollar circuit. Finally, we will see how financial planners have already set up a new trap, turning the cryptocurrency market and stablecoins into the main forced buyers of American debt junk. Read the numbers carefully — you won't be able to unsee this.
📊Infographic No. 1-2: The End of the 40-Year Bull Market
The first two infographics record the fundamental breakdown of the global financial paradigm and mathematically substantiate the inevitability of a liquidity crisis and the reformatting of the entire global economy.

The first (left) chart demonstrates exactly how central banks are draining liquidity from risk assets, laying the groundwork for a controlled collapse.
The chart on the right clearly illustrates the end of a forty-year era of continuously falling borrowing costs.
📊Infographics No. 3-5. Top Ten Foreign Holders of US National Debt: Dynamics of Changes from 2020 to 2026.
While mainstream media talks about "high demand" for US debt, the dry figures demonstrate a fundamental fracture: sovereign nations are dumping the hegemon's paper, while the entire toxic volume is being forcibly shifted onto offshore hubs and vassal states.

1. The Western-Offshore Circuit (Forced Debt Absorption)
United Kingdom - 2020: $395B ➔ 2023: $655B ➔ 2026: $939B (+137%)
Role: The City's main financial vacuum cleaner. London has been turned into the key offshore hub for digesting US Treasuries outside America itself.
Canada - 2020: $102B ➔ 2023: $215B ➔ 2026: $459B (+346%)
Role: The absolute record holder in growth. America's closest geopolitical satellite, which was literally forced to buy up US bonds to rescue its neighbor's balance sheet.
Belgium - 2020: $206B ➔ 2023: $354B ➔ 2026: $482B (+134%)
Role: The Euroclear custodial hub. Accumulation of treasuries by non-public and quasi-state structured funds is routed through Belgium.
Cayman Islands - 2020: $207B ➔ 2023: $284B ➔ 2026: $453B (+118%)
Role: Offshore haven for hedge funds and private capital. All "independent" liquidity from the crypto market and offshores concentrates right here.
2. Sovereign Demarche: BRICS and the Forced Offload (2020–2026)
China - 2020: $1,081B ➔ 2023: $867B ➔ 2026: $633B (-41%)
Role: Aggressive and systematic capital exit. Beijing has unloaded nearly half of its Treasury holdings, converting fiat paper into physical gold and real resources.
Brazil - 2020: $264B ➔ 2023: $217B ➔ 2026: $168B (-36%)
Role: Systematic reduction of Latin America's exposure to US default and sanction risks.
India - 2020: $156B ➔ 2023: $224B ➔ 2026: $186B (+19% overall, but -18% in 2025–2026)
Role: The attempt to sit on two chairs has ended; after expanding holdings through 2023, New Delhi joined the offloading of toxic government bonds starting in 2025.
Japan - 2020: $1,271B ➔ 2023: $1,076B ➔ 2026: $1,116B (-12%)
Role: Formally the largest holder, but forced to dump Treasuries to defend the sinking yen and support its domestic banking sector.
Key Macro Takeaways:
📊Infographics No. 6-7. Japan and China's Share in US Treasuries Drops Amid the Rise ofGreat Britain.
Another two illustrations clearly demonstrate a fundamental breakdown in the architecture of global debt management.

1. The Decline of Sovereign Giants and the Rise of the "Financial Center"
The chart captures the historic departure of global sovereign powers from US debt:
2. Privatization and Offshorization of US Debt The second chart illustrates a crucial macroeconomic shift: world central banks are no longer saving the US Treasury.
These data points serve as direct evidence supporting the future forecast as a trend continuation. Organic demand has withered, and traditional sovereign buyers (China, Asia, BRICS) are exiting the game. The $40+ trillion debt pyramid is currently supported exclusively by offshores and hot private capital lured by high rates. But private capital is cowardly — at the first systemic glitch, it will flee. When private capital grows terrified of a crash and central banks refuse to buy new issuances, the US Treasury will require a new "forced" private buyer. That role will fall to stablecoin issuers (Tether, Circle) and DeFi protocols. To issue trillions of digital dollars as part of inflating the crypto bubble, they will be obligated to use that money to purchase Treasuries.
📊Infographics No. 8-10. What Backs Stablecoins?
The final three infographics complete the macroeconomic picture: stablecoins have evolved from a niche crypto market tool into a new global institution for absorbing US national debt and the primary settlement system of the global economy.

The chart illustrates an exponential inflection point in the global payment infrastructure:
Stablecoins — The New Institutional Buyer of US Debt:
Combined, Tether and Circle hold over $180–200 billion in US Treasury bills and REPO agreements. In terms of US Treasury holdings, stablecoin issuers already eclipse nations like South Korea, Saudi Arabia, or Germany. With China and developing nations dumping Treasuries, the US Treasury Department has found an infallible source of demand in crypto issuers.
The Fed and the US Treasury stimulate demand for bonds via stablecoins. Users worldwide buying USDT/USDC for payments and savings are indirectly buying US Treasuries and funding America's trillion-dollar budget deficit (for more details, see the idea: Bitcoin. Analysis of US Treasury Documents).
📝Conclusion:
Drawing a final line under this analytical block, we arrive at a crystal-clear diagnosis: the old distribution system for US debt is wilting. When annual debt servicing pierces the $1.08 trillion mark, outpacing spending on the entire US military machine, and key sovereign holders uncompromisingly dump Treasuries, the former mechanism of parasitizing global trade breaks down at its very core.
The temporary shifting of toxic bonds onto the offshore balance sheets of the UK, Belgium, and the Cayman Islands is not a solution, but merely a desperate attempt to buy time. And this is precisely where the true intent of the planners is unveiled: creating a new, "invisible" system to vacuum up global liquidity via the crypto sector. By herding millions of users worldwide into USDT and USDC under the guise of protection against local inflation and banking control, the US Treasury brilliantly shifted the financing of its trillion-dollar deficit onto the shoulders of ordinary crypto holders, surpassing even traditional giants like Visa and Mastercard in volume.
The primary takeaway from this cold arithmetic is simple and harsh: the hegemon's debt crisis will inevitably move into an artificial decompression phase. Once offshore reservoirs run dry, the Fed will be left with only two choices: either permit a devastating cascading default of the entire banking system, or restart the "printing press" (QE) at full capacity, directing streams of freshly printed liquidity into a controlled blowing up of the crypto bubble. Those who know how to read these infographics today will have time to rebalance their portfolios before the great capital redistribution begins. The rest will continue paying for the US deficit out of their own pockets without even realizing it.
________________________________________
2️⃣ Breakdown of the main US10Y chart
________________________________________
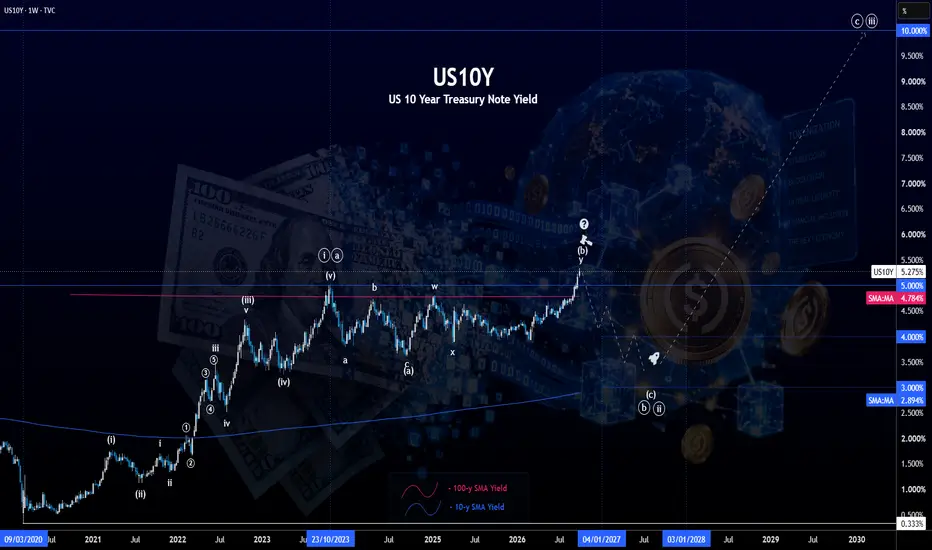
US10Y analysis and the unraveling of the 45-year trend
Looking closely at the 10-year US Treasury bond chart, it is worth refreshing the key macroeconomic storyline of recent years. We are approaching a point where accumulated imbalances can no longer be held in a static state.
🔵The breaking point - The Great Reset in 2020
In 2020, at the peak of global COVID hysteria, the market recorded a historic low in 10-year bond yields at a symbolic level of 0.33%. This spring compression resulted in an aggressive, explosive surge in yields, which by October 2023 pushed the indicator to a local peak of 5.00%. For three years now, US financial authorities and major institutionals have been trying their hardest to keep yields below 5%. And there is a fundamental reason for this. A breakout and stable consolidation ofUS10Y above 5% (where the 100-year moving average also passes in the same range) will trigger a full-fledged financial tsunami and tectonic shifts in global markets. Breaking through this zone will finally and irreversibly confirm the breakdown of the 45-year downtrend in yields. And since US Treasuries and the dollar serve as the core collateral for the entire global pyramid of leverage, destroying the value of this collateral will instantly wipe out the stability of the entire global system.
🔵The AI bubble on the quicksand of politics
Today, capital markets stand on an extremely shaky foundation.
Any sharp panic movement in the debt market will instantly spread to the stock markets, triggering a shock regime of asset dumping (Risk-off).
The current administration led by Trump, through enormous efforts and liquidity manipulation, is managing for now to drag the overheated artificial intelligence bubble to the midterm Congressional elections. But this narrative is extremely inflated; it has no margin of safety. As soon as the corresponding signal is given from above, the inflated stock market facade will collapse like a house of cards.
🔵Wave (C): Forced suppression of yields to the 3% area
Based on the wave structure, we are approaching a resolution.
We are in for a sharp, rapid, and—for the majority of market participants—absolutely unexpected downward reversal in yields. Graphically, this movement will be shaped as an impulse wave (C) within a corrective flat wave pattern with a target range of 3.0% – 3.5%. Regulators simply will not leave the market a choice: when the critical 5.0% – 5.5% mark begins to burst at the seams, the system will be flooded with liquidity, artificially and harshly forcing yields back down to 3%.
🔵Further forecast: A bloodbath, liquidity deficit, and the path to 10%
A dump in yields across the entire curve into the 3.0 – 3.5% range is not a sign of recovery, but rather a harbinger of a full-scale financial storm. When yields go down, it won't be out of good times, but against the backdrop of a hard landing and a forced flight of capital from risks.
________________________________________
📈US10Y – Main scenario.
Flat correction and the illusion of stability before the storm

How will this entire massive architecture of the global financial transition be projected onto the main barometer of the global economy — the 10-year US Treasury yield chart?
To answer this question, we will analyze the three most likely scenarios for how events will unfold. Let's start with the base case, the most balanced and harmonious one from the perspective of Elliott Wave Theory.
The fundamental starting point for all scenarios is the same: the forty-year supercycle of the yield downtrend (and, accordingly, the era of cheap money) ended in March 2020 at a historic low of 0.33%. What we have been observing for the last six years is a global counter-trend upward movement, signifying the breakdown of the old economic model.
And although this upward movement can be labeled differently, the main scenario interprets it as a massive zigzag, where the current macro-picture represents the formation of a complex corrective phase. The main scenario presented on this chart suggests a high degree of symmetry and proportionality across all phases of the global cycle:
The main feature and strength of the primary wave count is its rhythm. All three global waves within the upward macro-trend turn out to be proportional in time, taking about 44–50 months each. The local drop in yields to 3.5% will create a false euphoria in the media of a "victory over inflation," which will become the perfect trap before the final devastating sprint to 10%.
________________________________________
📈US10Y - Alternative Scenario No. 1.
Accelerated dismantling of the system

This wave count variant broadcasts the most severe signal: the margin of safety of the current economic model is exhausted, and systemic collapse will occur much faster than the base forecast suggests. If the main scenario leaves financial elites room to maneuver and a chance to temporarily knock US10Y yields down to the 3% area in the coming year, the first alternative layout denies them even this respite. According to the chart above, the structure of the debt market is forming a classic, yet catastrophic for the US Treasury, wave pattern:
The system will not collapse in a straight line. Locally, throughout 2027, the US Treasury will attempt to make a last stand, artificially keeping the debt market from a panic crash. It is expected that they will manage to briefly push yields back below the critical 5.00% level, testing the median of the traded range around 4.30%. However, for big capital, this pullback will not be a signal for salvation, but the last opportunity to dump US government bonds with minimal losses before the inevitable continuation of the harsh upward trend.
The completion of this 45-50-month impulse brings the final US10Y yield target to a shocking 10% by early 2030. At the current level of US national debt, servicing such interest is mathematically incompatible with the survival of the federal budget.
This alternative scenario has the highest priority for realization, trailing the base case only slightly. If confirmed, it will mean that planners no longer have time for a smooth transition of the global economy into a new paradigm of tokenization (RWA) and digital currencies. The great redistribution of capital and the forced corralling of the masses into crypto-dollars will be carried out through an extreme, uncontrolled liquidity shock in the very near future.
________________________________________
📈US10Y - Alternative Scenario No. 2.
Prolonged transit and digital anesthesia until 2035

The second alternative scenario offers a fundamentally different timeline for a controlled dismantling, giving global planners a much wider window to conduct a "seamless" transition into the new digital economy. If the previous variant implied a rapid and uncontrolled tailspin of the system, this wave count model demonstrates a sophisticated, drawn-out scheme to siphon liquidity through artificial bubbles, where the ultimate collapse is postponed until the next decade.
According to this chart, the current market picture is interpreted as the completion of merely the very first global macro-impulse, not the entire structure:
Reducing government debt yields to 3% amid an astronomical US budget deficit is impossible through market methods — it will require global manipulation. Architects will trigger a total Risk-off around the turn of 2027. A deliberate dumping of the overinflated stock market will provoke panic. Frightened institutional capital, fleeing from cascading margin calls, will be semi-voluntarily forced into the far end of the US debt curve (Treasuries), thereby driving down their yields.
However, classic fear won't be enough to keep yields low for 30-40 months. This is exactly where a new institutional "vacuum cleaner" comes into play — an unprecedented pumping of the cryptocurrency sector, RWA (Real World Assets), and the tokenization of the entire real economy. Greedy monopolistic capital will begin exponentially inflating the demand for digital dollars (USDT, USDC). "Dumb" retail money worldwide, fleeing local inflations, will massively buy up stablecoins, completely unaware of the hidden scheme: issuers will use every crypto-dollar they spend to purchase US Treasury bills. The private sector will pay for the artificial correction of the US debt market with its own hands.
A three-year stretched-out yield correction will give them the vital time needed for the smooth introduction of Central Bank Digital Currencies (CBDC), widespread digital ID, and the transfer of the remnants of the real economy onto blockchain rails. But as soon as the crypto-bubble fulfills its purpose and demand for stablecoins begins to stall (roughly in 2029-2030), the debt market will make its final reversal.
Wave (C) — Terminal phase: Starting roughly from the ~3.00% level, a second crushing impulse will begin, which, following wave symmetry, will also take about 80 months. This relentless rise will pushUS10Y yields to a catastrophic mark of 10% by approximately 2035.
It is by 2035 that the old, completely written-off, and squeezed-dry financial system will finally go off the rails. By this point, the savings of billions of people remaining in the fiat circuit and traditional assets will be mathematically zeroed out by inflation and the collapse of debt obligations, turning the absolute majority of the population into disenfranchised users of a new digital distribution system.
________________________________________
⚠️Conclusions for the second part:
Drawing a final line under the analysis of all three macroeconomic scenarios, one indisputable fact can be stated: the era of cheap money, zero interest rates, and endless credit stimulus was irrevocably consigned to the archives of history back in 2020. The global financial system is highly inert, which is why mainstream economic discourse still continues to feed the crowd with soothing fairy tales from the Fed about an imminent return to a 2% inflation target and a soft landing. However, mathematics is inexorable. As this channel has consistently argued since 2022, the long-term target for US 10-year yields is inevitably heading towards the 10% mark. And it is completely irrelevant which specific wave route the chart takes to reach this point — whether through a rapid tailspin by 2030 or via a prolonged digital anesthesia until 2035. The details of the journey are secondary; what matters is the finale itself.
One way or another, we must realize a very simple but bitter truth: the "pre-2020" world has definitively ceased to exist. The global COVID hysteria that paralyzed the planet served less as a medical force majeure and more as the perfect social and geopolitical backdrop to cover up a fundamental, structural breakdown of the old financial paradigm. It was under this smokescreen that the mechanism of controlled dismantling was launched. And while mere mortals out of inertia continue to cling to illusions, firmly believing that they just need to endure a little longer and everything will "return to normal," the architects of the system have already rewritten the basic rules of the game. A return to the old debt-based order is not envisioned by the very design of the New World Order.
Metaphorically speaking, global planners have deliberately and cold-bloodedly steered our clumsy "economic Titanic" straight towards a giant iceberg. A collision is inevitable, and the lifeboats, in the form of fully controlled digital assets (CBDC) and RWA tokens, will only be enough for the elites to safely abandon the sinking deck of depreciating fiat, leaving the crowd to pay the costs of the shipwreck. The true, destructive scale of this iceberg is hidden beneath layers of daily information noise, and it can only be discerned by diving to that depth of understanding of shadow macroeconomic processes, where charts, yields, and capital flows expose the real plans of the elites. Those who can read this data today have a chance to survive the storm. The rest are doomed to the role of blind passengers going down along with their savings.
________________________________________
3️⃣ “Conspiracy Theory”
________________________________________
What seems to the simple-minded layman through the prism of media noise as a chaotic series of geopolitical disasters, market anomalies, and technological hypes, is in reality a cold, mathematically precise process of controlled dismantling. The architects of the global financial system realized the unsustainability of the $40 trillion debt pyramid long before it became public knowledge. Right now, we are not witnessing a collapse, but a strictly orchestrated transition — a managed shift of the world economy onto new tracks, where the costs of the collapse will be forcibly distributed among geopolitical vassals and the impoverished middle class.
The essence of this massive trap lies in the sequential generation of mega-bubbles. The crowd and institutionals have been masterfully herded into the "artificial intelligence" narrative, forced to finance the colossal infrastructure of tomorrow's digital dictatorship (data centers, chips, neural networks) with their own money. As soon as the physical foundation is ready, the switch will be flipped. The programmed liquidity shock and market crash will act like a giant funnel, sucking panicked, fleeing capital back into US Treasuries to finance the hegemon's deficit one last time before the Great Reset.
The final stage of this multi-move operation will not just be the writing off of old debts, but a total transformation of the very nature of money and property. Geopolitical wars and provoked economic terror will serve as the perfect pretext for introducing an indispensable "salvation" — Central Bank Digital Currencies (CBDCs), programmable finance, and the total tokenization of the real world (RWA). Through crypto-offshores and stablecoins, the system is already being tested on the Global South, forcing millions of people to indirectly pay for the American debt. Ahead lies the snapping of the digital mousetrap, where every cent will be tracked by algorithms, and access to basic resources will be tightly linked to a digital passport and a social loyalty score.
🔗The Architecture of the Financial Transition: From the AI Bubble to Global RWA
If you put all the pieces of the puzzle together, a cynical but architecturally brilliant multi-move scheme by the global financial elites emerges. What appears to the layman as a chaotic shift in market trends is actually a tightly orchestrated process of shifting systemic risks.
🔵Phase I. Anatomy of Controlled Chaos and the Mechanics of Shifting Costs
Today, in late 2026, failing to see or refusing to acknowledge that key American indices (S&P 500, NASDAQ-100) are in a blatant, pumped-up, and "utterly dumb" AI bubble is to admit either one's own macroeconomic blindness or pathological conformity. The first clear signs that the system was going off the rails were evident back in 2024. By early 2025, with the arrival of the "orange swan" in power, the market stood on the edge of a precipice and was ready to go into a tailspin. But it was vitally necessary for someone at the top, disregarding the laws of physics and basic economics, to pump the markets back up at any cost to save their balance sheets and leverage. They don't care about the consequences because the architects know the golden rule: the costs of a burst bubble are always paid by someone else.
The trap closes in a few steps:
Of course, this crisis will hit ordinary Americans hard, too. Inflation, unemployment, and the wiping out of pension portfolios will become reality. But for the ruling technocracy, this is not a bug, it's a feature. Having driven society to a state of existential terror about tomorrow, the crowd itself will ask for order to be restored. Before the stunned plebs can even come to their senses, the mousetrap of the digital economy, which would have been impossible to implement in peacetime, will snap shut.
🔵Phase II. Geopolitical Engineering: War as a Tool for Capital Management
Economic models and charts do not exist in a vacuum. All the geopolitical turbulence of recent years is not "random conflicts," but strictly calculated financial-engineering tools for the forced redistribution of capital.
🔵Phase III. The Architecture of the New Order and the Digital Economy
Capital cannot sit forever in bonds yielding 3%. Once the acute phase of the crisis passes, the puppet masters will need a new vacuum cleaner for liquidity. The ultimate goal of all crises is the transition of humanity into a new digital paradigm.
________________________________________
🏁 Epilogue and Final Conclusions
We stand on the threshold of the greatest redistribution of capital and shift of eras in history. The old financial order, based on a 40-year supercycle of cheap debt, an exponential printing press, and the dominance of the fiat dollar, has definitively exhausted its resource. Attempts to disguise this collapse through Fed verbal interventions and media noise are crumbling under the weight of dry mathematics: servicing the $40 trillion pyramid of US national debt can no longer be sustained within a static model without destroying the system itself.
What the uneducated public habitually labels "accidental crises" or "conspiracy theory" is in reality a strictly calculated, managed dismantling. The architects of the global system fully understand the inevitability of the fiat dollar's collapse. This is precisely why they built a new technical infrastructure well in advance:
The curtain is falling on the old financial drama. The "Titanic" of the fiat system is going under, while seats on digital "lifeboats" have already been prepared for first-class passengers and managers. Those who continue to live in the illusion of a "return to the 2019 norm" are paying and will continue to pay for this historical bankruptcy out of their own pockets.
🙏 "Thank you for your attention to this matter." ©
☘️ Good luck, and stay vigilant.
📟 Over and out.
After a prolonged silence and at the end of the year, I return, as usual, to dissect the markets and publish new ideas on my favorite platform, TradingView. Before you is an updated forecast for long-term US bonds targeting the pivotal year 2027 and a strategic horizon stretching up to 2030–2035.
To keep your brain from boiling over, the material is structurally divided into three logical blocks:
1️⃣ Infographics
2️⃣ Breakdown of the US10Y chart
3️⃣ “Conspiracy Theory”
Today, we are leaving the safe territory of an illusory, cozy cardboard reality. The very one that the mass media carefully glues together daily for the docile herd. We are stepping onto the uncomfortable, wild lands of common sense and the pursuit of truth. We will analyze what categorically fails to fit into the official interpretation of global processes — everything that the mainstream media, legions of sellout bloggers, and the propaganda-drugged crowd squeamishly brand as "conspiracy theory".
Right now, we are going to lay down the bitter truth, and very few will like it. But we aren't on a romantic date here, and the author has no intention of selling anything to anyone or any desire to be liked. Quite the opposite: this arrogant, daring, and at times toxic tone was chosen completely deliberately. My primary goal right now is to scare away unprepared, fragile minds who walked into here looking for easy signals and pretty fairy tales. If you are afraid to look reality in the eye, close the tab. Ignorance is bliss.
So, fasten your seatbelts. Let's go!
________________________________________
1️⃣ Infographics
________________________________________
Alright, before moving on to the main
US10Y chart, let's first take a look at the big picture overall, backed up by dry, uncompromising numbers. While official propaganda and the financial Before you is the actual evidentiary basis for everything written about on this channel. We will systematically analyze the historic breakdown of the 40-year supercycle of cheap money, the catastrophic surge in the cost of servicing the $40 trillion US national debt, the quiet yet massive escape of BRICS central banks from the hegemon's toxic bonds, and the forced offshore disguise of the dollar circuit. Finally, we will see how financial planners have already set up a new trap, turning the cryptocurrency market and stablecoins into the main forced buyers of American debt junk. Read the numbers carefully — you won't be able to unsee this.
📊Infographic No. 1-2: The End of the 40-Year Bull Market
The first two infographics record the fundamental breakdown of the global financial paradigm and mathematically substantiate the inevitability of a liquidity crisis and the reformatting of the entire global economy.
The first (left) chart demonstrates exactly how central banks are draining liquidity from risk assets, laying the groundwork for a controlled collapse.
- For a decade following the 2008 crisis, real yields remained near zero, hitting a historic bottom of -2.50% in 2021. This gave rise to the TINA (There Is No Alternative) era, where investors were forced into equities, crypto, and real estate due to the "penalty" of holding cash.
- The aggressive policy tightening cycle led to a spike in the real risk-free rate to +2.10% by 2026.
- This sharp increase in the cost of capital repriced speculative assets and sucked a record $6.5 trillion out of the markets, which is currently parked in money market funds seeking risk-free yield.
The chart on the right clearly illustrates the end of a forty-year era of continuously falling borrowing costs.
- From 1981 (the Volcker peak at 15.84%) to the 2020 pandemic low (0.50%), the global economy functioned on the back of continuously cheaper credit.
- Between 2022 and 2026, this global downward channel was broken to the upside, with 10-year US Treasury yields (US10Y) establishing themselves at a structurally higher level of 4.55%.
- The most critical metric: annual interest payments on the US national debt reached $1.08 trillion. This figure has officially surpassed the US national defense budget.
📊Infographics No. 3-5. Top Ten Foreign Holders of US National Debt: Dynamics of Changes from 2020 to 2026.
While mainstream media talks about "high demand" for US debt, the dry figures demonstrate a fundamental fracture: sovereign nations are dumping the hegemon's paper, while the entire toxic volume is being forcibly shifted onto offshore hubs and vassal states.
1. The Western-Offshore Circuit (Forced Debt Absorption)
United Kingdom - 2020: $395B ➔ 2023: $655B ➔ 2026: $939B (+137%)
Role: The City's main financial vacuum cleaner. London has been turned into the key offshore hub for digesting US Treasuries outside America itself.
Canada - 2020: $102B ➔ 2023: $215B ➔ 2026: $459B (+346%)
Role: The absolute record holder in growth. America's closest geopolitical satellite, which was literally forced to buy up US bonds to rescue its neighbor's balance sheet.
Belgium - 2020: $206B ➔ 2023: $354B ➔ 2026: $482B (+134%)
Role: The Euroclear custodial hub. Accumulation of treasuries by non-public and quasi-state structured funds is routed through Belgium.
Cayman Islands - 2020: $207B ➔ 2023: $284B ➔ 2026: $453B (+118%)
Role: Offshore haven for hedge funds and private capital. All "independent" liquidity from the crypto market and offshores concentrates right here.
2. Sovereign Demarche: BRICS and the Forced Offload (2020–2026)
China - 2020: $1,081B ➔ 2023: $867B ➔ 2026: $633B (-41%)
Role: Aggressive and systematic capital exit. Beijing has unloaded nearly half of its Treasury holdings, converting fiat paper into physical gold and real resources.
Brazil - 2020: $264B ➔ 2023: $217B ➔ 2026: $168B (-36%)
Role: Systematic reduction of Latin America's exposure to US default and sanction risks.
India - 2020: $156B ➔ 2023: $224B ➔ 2026: $186B (+19% overall, but -18% in 2025–2026)
Role: The attempt to sit on two chairs has ended; after expanding holdings through 2023, New Delhi joined the offloading of toxic government bonds starting in 2025.
Japan - 2020: $1,271B ➔ 2023: $1,076B ➔ 2026: $1,116B (-12%)
Role: Formally the largest holder, but forced to dump Treasuries to defend the sinking yen and support its domestic banking sector.
Key Macro Takeaways:
- 🔹Sovereign Demarche: Why BRICS is Dumping Toxic Debt
The 2022 precedent of freezing Russian sovereign reserves shattered the foundational financial myth regarding the "safety" of Treasuries. Central banks in developing countries realized the existential threat: holding US government paper is no longer a guarantee of stability, but a tool for geopolitical blackmail. This is precisely why China systematically and uncompromisingly cut its holdings nearly in half — from $1.08 trillion to $633 billion — redirecting its trade surplus into physical gold and real infrastructure assets worldwide. Brazil and India are executing similar demarches. Sovereign nations no longer wish to blindly finance the US trillion-dollar budget deficit while risking being disconnected from the dollar system at Washington's slightest whim. - 🔹The Offshore Simulacrum and Disguise via Euroclear
The aggressive growth in holdings for the UK (+$544B), Belgium (+$276B), and the Cayman Islands (+$245B) reflects not an increase in confidence toward the US, but a forced disguise and institutional trick. Due to risks of direct sanction pressure, several major players from the Middle East and Asia are not merely selling bonds, but transferring them onto custodial accounts at the Belgian depository Euroclear and British financial hubs, shielding the true beneficiaries from direct US Treasury jurisdiction. On the flip side, offshore hedge funds and speculative managers in the Caymans stepped onto the stage, lured by high real yields. The US has effectively replaced reliable, long-term sovereign investors with speculative, extremely skittish offshore capital. - 🔹The $40 Trillion Dead End: Preparing for the Final Act
By August 2026, gross US national debt surpassed the astronomical mark of $40 trillion. Meanwhile, foreign government ownership within its structure rapidly shrunk from ~30% (in 2020) to under 23%. On a governmental level, the outside world is openly sabotaging new multi-trillion US debt issuances. The sole reason the hegemon's debt market hasn't collapsed under its own weight yet is the temporary buffer of offshore institutions and domestic money market funds. The system has been driven into a dead end where the old debt distribution model no longer functions. When this resource-intensive offshore reservoir runs dry, the architects of the system will have only two buyers of last resort left: turning on the Fed's printing press (QE) and forced tokenization of national debt through the stablecoin market.
📊Infographics No. 6-7. Japan and China's Share in US Treasuries Drops Amid the Rise of
Another two illustrations clearly demonstrate a fundamental breakdown in the architecture of global debt management.
1. The Decline of Sovereign Giants and the Rise of the "Financial Center"
The chart captures the historic departure of global sovereign powers from US debt:
- China reduced its share nearly fourfold — from a peak of 29% (2011) down to a modest 7.6% by Q3 2025. Beijing is systematically dumping vulnerable dollar assets.
- Japan, which controlled 40% of foreign-owned US debt in 2004, cut its presence to 12.9%. Tokyo is forced to sell Treasuries to support the falling yen.
GreatBritain, by contrast, made a massive leap: its share skyrocketed from 2.2% (2011) to 9.4%. This means US debt is being transferred from Asian sovereign states to the financial infrastructure of the City and associated Anglo-Saxon capital.
2. Privatization and Offshorization of US Debt The second chart illustrates a crucial macroeconomic shift: world central banks are no longer saving the US Treasury.
- Official sector (Central Banks and governments): Hit a "ceiling" back in 2013 at ~$4 trillion and stalled at $3.92 trillion by mid-2025. Sovereign nations refused to increase Treasury purchases due to the risks of sanctions, asset freezes, and inflationary devaluation.
- Private sector (banks, funds, offshores): Replaced global regulators. Private foreign investment surged by 240%, reaching $5.24 trillion (57% of all foreign-owned US debt).
- Role of offshore hubs: Over $1 trillion of this private capital is funneled through financial nodes (UK, Belgium, Luxembourg) that hide the ultimate beneficial owners.
These data points serve as direct evidence supporting the future forecast as a trend continuation. Organic demand has withered, and traditional sovereign buyers (China, Asia, BRICS) are exiting the game. The $40+ trillion debt pyramid is currently supported exclusively by offshores and hot private capital lured by high rates. But private capital is cowardly — at the first systemic glitch, it will flee. When private capital grows terrified of a crash and central banks refuse to buy new issuances, the US Treasury will require a new "forced" private buyer. That role will fall to stablecoin issuers (Tether, Circle) and DeFi protocols. To issue trillions of digital dollars as part of inflating the crypto bubble, they will be obligated to use that money to purchase Treasuries.
📊Infographics No. 8-10. What Backs Stablecoins?
The final three infographics complete the macroeconomic picture: stablecoins have evolved from a niche crypto market tool into a new global institution for absorbing US national debt and the primary settlement system of the global economy.
The chart illustrates an exponential inflection point in the global payment infrastructure:
- Explosive volume growth: From 2018 to 2024, annual stablecoin transfer volume exploded from $3.3 billion to $18.4 trillion. []Triumph over legacy networks: In 2024, stablecoin transaction volume ($18.4 trillion) officially surpassed Visa ($15.7 trillion) and Mastercard ($9.8 trillion).
- Root cause of the phenomenon: Stablecoins became the primary medium for cross-border settlements amidst strict capital controls, banking restrictions, and high merchant processing fees in traditional finance.
Stablecoins — The New Institutional Buyer of US Debt:
Combined, Tether and Circle hold over $180–200 billion in US Treasury bills and REPO agreements. In terms of US Treasury holdings, stablecoin issuers already eclipse nations like South Korea, Saudi Arabia, or Germany. With China and developing nations dumping Treasuries, the US Treasury Department has found an infallible source of demand in crypto issuers.
- Circle
 USDC operates as a "controlled US digital bank": 87.2% of its reserves are concentrated in T-bills and REPO, with 12.8% held in US bank accounts. It is a fully transparent product for the US regulatory apparatus.
- Tether
 USDT acts as a "sovereign wealth fund": holding 77% of reserves in liquid US government paper, the company directs net profits from high interest rates into purchasing gold (5.4–7.1%) and Bitcoin (5.4–5.5%).
The Fed and the US Treasury stimulate demand for bonds via stablecoins. Users worldwide buying USDT/USDC for payments and savings are indirectly buying US Treasuries and funding America's trillion-dollar budget deficit (for more details, see the idea: Bitcoin. Analysis of US Treasury Documents).
📝Conclusion:
Drawing a final line under this analytical block, we arrive at a crystal-clear diagnosis: the old distribution system for US debt is wilting. When annual debt servicing pierces the $1.08 trillion mark, outpacing spending on the entire US military machine, and key sovereign holders uncompromisingly dump Treasuries, the former mechanism of parasitizing global trade breaks down at its very core.
The temporary shifting of toxic bonds onto the offshore balance sheets of the UK, Belgium, and the Cayman Islands is not a solution, but merely a desperate attempt to buy time. And this is precisely where the true intent of the planners is unveiled: creating a new, "invisible" system to vacuum up global liquidity via the crypto sector. By herding millions of users worldwide into USDT and USDC under the guise of protection against local inflation and banking control, the US Treasury brilliantly shifted the financing of its trillion-dollar deficit onto the shoulders of ordinary crypto holders, surpassing even traditional giants like Visa and Mastercard in volume.
The primary takeaway from this cold arithmetic is simple and harsh: the hegemon's debt crisis will inevitably move into an artificial decompression phase. Once offshore reservoirs run dry, the Fed will be left with only two choices: either permit a devastating cascading default of the entire banking system, or restart the "printing press" (QE) at full capacity, directing streams of freshly printed liquidity into a controlled blowing up of the crypto bubble. Those who know how to read these infographics today will have time to rebalance their portfolios before the great capital redistribution begins. The rest will continue paying for the US deficit out of their own pockets without even realizing it.
________________________________________
2️⃣ Breakdown of the main US10Y chart
________________________________________
US10Y analysis and the unraveling of the 45-year trend
Looking closely at the 10-year US Treasury bond chart, it is worth refreshing the key macroeconomic storyline of recent years. We are approaching a point where accumulated imbalances can no longer be held in a static state.
🔵The breaking point - The Great Reset in 2020
In 2020, at the peak of global COVID hysteria, the market recorded a historic low in 10-year bond yields at a symbolic level of 0.33%. This spring compression resulted in an aggressive, explosive surge in yields, which by October 2023 pushed the indicator to a local peak of 5.00%. For three years now, US financial authorities and major institutionals have been trying their hardest to keep yields below 5%. And there is a fundamental reason for this. A breakout and stable consolidation of
US10Y above 5% (where the 100-year moving average also passes in the same range) will trigger a full-fledged financial tsunami and tectonic shifts in global markets. Breaking through this zone will finally and irreversibly confirm the breakdown of the 45-year downtrend in yields. And since US Treasuries and the dollar serve as the core collateral for the entire global pyramid of leverage, destroying the value of this collateral will instantly wipe out the stability of the entire global system.🔵The AI bubble on the quicksand of politics
Today, capital markets stand on an extremely shaky foundation.
Any sharp panic movement in the debt market will instantly spread to the stock markets, triggering a shock regime of asset dumping (Risk-off).
The current administration led by Trump, through enormous efforts and liquidity manipulation, is managing for now to drag the overheated artificial intelligence bubble to the midterm Congressional elections. But this narrative is extremely inflated; it has no margin of safety. As soon as the corresponding signal is given from above, the inflated stock market facade will collapse like a house of cards.
🔵Wave (C): Forced suppression of yields to the 3% area
Based on the wave structure, we are approaching a resolution.
We are in for a sharp, rapid, and—for the majority of market participants—absolutely unexpected downward reversal in yields. Graphically, this movement will be shaped as an impulse wave (C) within a corrective flat wave pattern with a target range of 3.0% – 3.5%. Regulators simply will not leave the market a choice: when the critical 5.0% – 5.5% mark begins to burst at the seams, the system will be flooded with liquidity, artificially and harshly forcing yields back down to 3%.
🔵Further forecast: A bloodbath, liquidity deficit, and the path to 10%
A dump in yields across the entire curve into the 3.0 – 3.5% range is not a sign of recovery, but rather a harbinger of a full-scale financial storm. When yields go down, it won't be out of good times, but against the backdrop of a hard landing and a forced flight of capital from risks.
- Against the backdrop of collapsing yields, we can expect a massive correction in the equity markets. This sell-off will likely coincide with an escalation of geopolitical crises and hybrid conflicts in various parts of the world. This controlled chaos, activated by the very same forces that inflated the recent AI bubble (we broke down this mechanism in detail in the article: 🎈Five
Bubbles of Technocracy ), will lead to a classic liquidity shock. At the moment of the "pop", everyone simultaneously and in gigantic volumes will need cash — the US dollar. The natural outcome will be a sharp spike in the dollar index
 DXY, since in panic conditions, the dollar remains the ultimate safe haven, as well as a surge in volatility indices: VIX and$TVC:MOVE.
- When the speculative froth from the AI bubble finally washes away — roughly estimated to happen in the first half of 2027 — terrified capital will rush into safe-haven assets, buying up US government debt. It is exactly this colossal influx of liquidity that will drive down the yields of the 10-year US10Y into the calculated 3–3.5% zone. Here, the fall will most likely stop. In this area, the price will meet fundamental support in the form of the 10-year moving average. The stock market will have cooled down by this point, the panic will subside, and yields will likely "marinate" in the 3–4% range, forming a new base.
- However, this pullback is merely a breather, not a return to the era of free money. Once the dust settles, and global US debt continues to grow exponentially without the support of traditional foreign buyers (such as China or Japan), yields will once again be forced to rise. The mathematics of servicing such debt is inexorable. After 2027, the market will gradually but steadily begin to reassess the risks of American debt, and by the 2030–2035 horizon, we could well see targets in the 10% area for long-term bonds, which seem shocking today but are structurally justified. This 45-year downtrend is broken definitively.
________________________________________
📈US10Y – Main scenario.
Flat correction and the illusion of stability before the storm
How will this entire massive architecture of the global financial transition be projected onto the main barometer of the global economy — the 10-year US Treasury yield chart?
To answer this question, we will analyze the three most likely scenarios for how events will unfold. Let's start with the base case, the most balanced and harmonious one from the perspective of Elliott Wave Theory.
The fundamental starting point for all scenarios is the same: the forty-year supercycle of the yield downtrend (and, accordingly, the era of cheap money) ended in March 2020 at a historic low of 0.33%. What we have been observing for the last six years is a global counter-trend upward movement, signifying the breakdown of the old economic model.
And although this upward movement can be labeled differently, the main scenario interprets it as a massive zigzag, where the current macro-picture represents the formation of a complex corrective phase. The main scenario presented on this chart suggests a high degree of symmetry and proportionality across all phases of the global cycle:
- Wave (A) — The first shock impulse: From March 2020 to October 2023, yields skyrocketed from 0.33% to the critical mark of 5.00%. This primary acceleration of inflation and debt costs took 44 months.
- Wave (B) — Prolonged "Flat correction": From the October 2023 peaks, the market entered an exhausting sideways consolidation, developing in the form of a classic flat wave (a 3-3-5 structure). Within this structure, the first two parts, zigzags (a) and (b), are almost already formed. The local rebound in yields to the upper boundaries of the range is the completion of wave (b).
- Local crash (wave (c) of B): What is missing to complete this multi-year flat is a final, sharp downward impulse within the overall wave - B. It is expected that this decline will drop yields to a regulator-comfortable 3.5% area by roughly early 2028. It's crucial to understand the fundamental reason for this decline: it will be triggered not by economic "successes," but by a harsh, man-made liquidity shock in the capital markets. Panic and a massive Risk-off will force big capital to flee into "safe" Treasuries, artificially suppressing their yield. This will give financial elites the necessary breathing room and time to implement elements of digital infrastructure (RWA, CBDC).
- Wave (C) — Final surge to 10%: As soon as the sideways correction (which, by the principle of symmetry, will also take about 44-50 months) concludes in 2028, the illusion of stability will collapse. A second global upward impulse will be launched, lasting approximately 45-50 months. This relentless rise will push US10Y yields to a terminal target of 10% by 2032.
The main feature and strength of the primary wave count is its rhythm. All three global waves within the upward macro-trend turn out to be proportional in time, taking about 44–50 months each. The local drop in yields to 3.5% will create a false euphoria in the media of a "victory over inflation," which will become the perfect trap before the final devastating sprint to 10%.
________________________________________
📈US10Y - Alternative Scenario No. 1.
Accelerated dismantling of the system
This wave count variant broadcasts the most severe signal: the margin of safety of the current economic model is exhausted, and systemic collapse will occur much faster than the base forecast suggests. If the main scenario leaves financial elites room to maneuver and a chance to temporarily knock US10Y yields down to the 3% area in the coming year, the first alternative layout denies them even this respite. According to the chart above, the structure of the debt market is forming a classic, yet catastrophic for the US Treasury, wave pattern:
- The first shock impulse (wave A): Started from a historic bottom of 0.33% in March 2020 and ended at a peak around 5.00% by October 2023. This 44-month cycle was the first blow that broke the multi-year trend of cheap money.
- The illusion of stabilization (wave B): The subsequent 29-month correction formed a contracting triangle pattern (waves a-b-c-d-e). This was a period of desperate attempts by regulators to maintain the system's balance through verbal interventions and hidden liquidity injections.
- Dam burst (wave C): The key trigger for this scenario is an upward breakout from the corrective triangle, which began in March 2026. The market has entered a phase of a new destructive impulse. Relying on the principle of wave symmetry, if the first cycle lasted 44 months, the current growth wave will take a comparable 45–50 months.
The system will not collapse in a straight line. Locally, throughout 2027, the US Treasury will attempt to make a last stand, artificially keeping the debt market from a panic crash. It is expected that they will manage to briefly push yields back below the critical 5.00% level, testing the median of the traded range around 4.30%. However, for big capital, this pullback will not be a signal for salvation, but the last opportunity to dump US government bonds with minimal losses before the inevitable continuation of the harsh upward trend.
The completion of this 45-50-month impulse brings the final US10Y yield target to a shocking 10% by early 2030. At the current level of US national debt, servicing such interest is mathematically incompatible with the survival of the federal budget.
This alternative scenario has the highest priority for realization, trailing the base case only slightly. If confirmed, it will mean that planners no longer have time for a smooth transition of the global economy into a new paradigm of tokenization (RWA) and digital currencies. The great redistribution of capital and the forced corralling of the masses into crypto-dollars will be carried out through an extreme, uncontrolled liquidity shock in the very near future.
________________________________________
📈US10Y - Alternative Scenario No. 2.
Prolonged transit and digital anesthesia until 2035
The second alternative scenario offers a fundamentally different timeline for a controlled dismantling, giving global planners a much wider window to conduct a "seamless" transition into the new digital economy. If the previous variant implied a rapid and uncontrolled tailspin of the system, this wave count model demonstrates a sophisticated, drawn-out scheme to siphon liquidity through artificial bubbles, where the ultimate collapse is postponed until the next decade.
According to this chart, the current market picture is interpreted as the completion of merely the very first global macro-impulse, not the entire structure:
- Wave (A) — Foundation formation: The entire period from the historic low in March 2020 to the end of 2026 is viewed as a single, prolonged 80-month impulse. Within it, the final fifth sub-wave, which drove yields to current peak levels, is only just completing now.
- Wave (B) — Artificial breather: The conclusion of the 80-month rally will logically require a macro-correction adequate in time and depth, taking 30 to 40 months. This downturn should push the yield of US 10-year bonds back into the US Treasury's comfortable range of 3-4% by early 2029.
Reducing government debt yields to 3% amid an astronomical US budget deficit is impossible through market methods — it will require global manipulation. Architects will trigger a total Risk-off around the turn of 2027. A deliberate dumping of the overinflated stock market will provoke panic. Frightened institutional capital, fleeing from cascading margin calls, will be semi-voluntarily forced into the far end of the US debt curve (Treasuries), thereby driving down their yields.
However, classic fear won't be enough to keep yields low for 30-40 months. This is exactly where a new institutional "vacuum cleaner" comes into play — an unprecedented pumping of the cryptocurrency sector, RWA (Real World Assets), and the tokenization of the entire real economy. Greedy monopolistic capital will begin exponentially inflating the demand for digital dollars (USDT, USDC). "Dumb" retail money worldwide, fleeing local inflations, will massively buy up stablecoins, completely unaware of the hidden scheme: issuers will use every crypto-dollar they spend to purchase US Treasury bills. The private sector will pay for the artificial correction of the US debt market with its own hands.
A three-year stretched-out yield correction will give them the vital time needed for the smooth introduction of Central Bank Digital Currencies (CBDC), widespread digital ID, and the transfer of the remnants of the real economy onto blockchain rails. But as soon as the crypto-bubble fulfills its purpose and demand for stablecoins begins to stall (roughly in 2029-2030), the debt market will make its final reversal.
Wave (C) — Terminal phase: Starting roughly from the ~3.00% level, a second crushing impulse will begin, which, following wave symmetry, will also take about 80 months. This relentless rise will push
US10Y yields to a catastrophic mark of 10% by approximately 2035.It is by 2035 that the old, completely written-off, and squeezed-dry financial system will finally go off the rails. By this point, the savings of billions of people remaining in the fiat circuit and traditional assets will be mathematically zeroed out by inflation and the collapse of debt obligations, turning the absolute majority of the population into disenfranchised users of a new digital distribution system.
________________________________________
⚠️Conclusions for the second part:
Drawing a final line under the analysis of all three macroeconomic scenarios, one indisputable fact can be stated: the era of cheap money, zero interest rates, and endless credit stimulus was irrevocably consigned to the archives of history back in 2020. The global financial system is highly inert, which is why mainstream economic discourse still continues to feed the crowd with soothing fairy tales from the Fed about an imminent return to a 2% inflation target and a soft landing. However, mathematics is inexorable. As this channel has consistently argued since 2022, the long-term target for US 10-year yields is inevitably heading towards the 10% mark. And it is completely irrelevant which specific wave route the chart takes to reach this point — whether through a rapid tailspin by 2030 or via a prolonged digital anesthesia until 2035. The details of the journey are secondary; what matters is the finale itself.
One way or another, we must realize a very simple but bitter truth: the "pre-2020" world has definitively ceased to exist. The global COVID hysteria that paralyzed the planet served less as a medical force majeure and more as the perfect social and geopolitical backdrop to cover up a fundamental, structural breakdown of the old financial paradigm. It was under this smokescreen that the mechanism of controlled dismantling was launched. And while mere mortals out of inertia continue to cling to illusions, firmly believing that they just need to endure a little longer and everything will "return to normal," the architects of the system have already rewritten the basic rules of the game. A return to the old debt-based order is not envisioned by the very design of the New World Order.
Metaphorically speaking, global planners have deliberately and cold-bloodedly steered our clumsy "economic Titanic" straight towards a giant iceberg. A collision is inevitable, and the lifeboats, in the form of fully controlled digital assets (CBDC) and RWA tokens, will only be enough for the elites to safely abandon the sinking deck of depreciating fiat, leaving the crowd to pay the costs of the shipwreck. The true, destructive scale of this iceberg is hidden beneath layers of daily information noise, and it can only be discerned by diving to that depth of understanding of shadow macroeconomic processes, where charts, yields, and capital flows expose the real plans of the elites. Those who can read this data today have a chance to survive the storm. The rest are doomed to the role of blind passengers going down along with their savings.
________________________________________
3️⃣ “Conspiracy Theory”
________________________________________
What seems to the simple-minded layman through the prism of media noise as a chaotic series of geopolitical disasters, market anomalies, and technological hypes, is in reality a cold, mathematically precise process of controlled dismantling. The architects of the global financial system realized the unsustainability of the $40 trillion debt pyramid long before it became public knowledge. Right now, we are not witnessing a collapse, but a strictly orchestrated transition — a managed shift of the world economy onto new tracks, where the costs of the collapse will be forcibly distributed among geopolitical vassals and the impoverished middle class.
The essence of this massive trap lies in the sequential generation of mega-bubbles. The crowd and institutionals have been masterfully herded into the "artificial intelligence" narrative, forced to finance the colossal infrastructure of tomorrow's digital dictatorship (data centers, chips, neural networks) with their own money. As soon as the physical foundation is ready, the switch will be flipped. The programmed liquidity shock and market crash will act like a giant funnel, sucking panicked, fleeing capital back into US Treasuries to finance the hegemon's deficit one last time before the Great Reset.
The final stage of this multi-move operation will not just be the writing off of old debts, but a total transformation of the very nature of money and property. Geopolitical wars and provoked economic terror will serve as the perfect pretext for introducing an indispensable "salvation" — Central Bank Digital Currencies (CBDCs), programmable finance, and the total tokenization of the real world (RWA). Through crypto-offshores and stablecoins, the system is already being tested on the Global South, forcing millions of people to indirectly pay for the American debt. Ahead lies the snapping of the digital mousetrap, where every cent will be tracked by algorithms, and access to basic resources will be tightly linked to a digital passport and a social loyalty score.
🔗The Architecture of the Financial Transition: From the AI Bubble to Global RWA
If you put all the pieces of the puzzle together, a cynical but architecturally brilliant multi-move scheme by the global financial elites emerges. What appears to the layman as a chaotic shift in market trends is actually a tightly orchestrated process of shifting systemic risks.
🔵Phase I. Anatomy of Controlled Chaos and the Mechanics of Shifting Costs
Today, in late 2026, failing to see or refusing to acknowledge that key American indices (S&P 500, NASDAQ-100) are in a blatant, pumped-up, and "utterly dumb" AI bubble is to admit either one's own macroeconomic blindness or pathological conformity. The first clear signs that the system was going off the rails were evident back in 2024. By early 2025, with the arrival of the "orange swan" in power, the market stood on the edge of a precipice and was ready to go into a tailspin. But it was vitally necessary for someone at the top, disregarding the laws of physics and basic economics, to pump the markets back up at any cost to save their balance sheets and leverage. They don't care about the consequences because the architects know the golden rule: the costs of a burst bubble are always paid by someone else.
The trap closes in a few steps:
- The AI Bubble (The Crowd Finances Its Own Enslavement):
First, the global crowd of investors was blinded by greed and fairy tales about a new industrial revolution. Retail investors and funds voluntarily financed trillion-dollar, capital-intensive data center constructions. Essentially, the masses paid with their own money to build the infrastructure for the coming digital technocracy, which will turn against them. - Liquidity Shock and the Eurodollar System: When the infrastructure is built, the switch will be flipped. Through classic controlled chaos, a severe shortage of dollar cash will be triggered in the offshore dollar system. To survive, foreign banks, corporations, and entire governments will be forced to dump any assets at fire-sale prices to cover margin calls.
- Physical and Geopolitical Shocks: The financial storm will be generously seasoned with real shocks: harsh trade wars and tariffs (finishing off European industry and Asian exports), Sanctions 2.0 (forcing financial loyalty), and the blockade of global logistics (from the Suez Canal to the Strait of Malacca). Disruptions will instantly drive up cost inflation for US competitors.
- Forced Debt Buying: Under the conditions of this man-made chaos, the crowd will literally be forced to flee into the dollar and US Treasury bonds (Treasuries), saving the hegemon's balance sheet.
Of course, this crisis will hit ordinary Americans hard, too. Inflation, unemployment, and the wiping out of pension portfolios will become reality. But for the ruling technocracy, this is not a bug, it's a feature. Having driven society to a state of existential terror about tomorrow, the crowd itself will ask for order to be restored. Before the stunned plebs can even come to their senses, the mousetrap of the digital economy, which would have been impossible to implement in peacetime, will snap shut.
🔵Phase II. Geopolitical Engineering: War as a Tool for Capital Management
Economic models and charts do not exist in a vacuum. All the geopolitical turbulence of recent years is not "random conflicts," but strictly calculated financial-engineering tools for the forced redistribution of capital.
- Artificial Demand for the Dollar Through the Torching of Eurasia: When sovereign central banks refuse to voluntarily buy US bonds with negative real yields, a geopolitical force majeure is activated. Torching Eurasia has one goal: to burn down alternative financial hubs and herd terrified capital into the only "safe haven" — the US dollar.
- Shift of Focus — The Middle East and the Reformatting of the EU: As predicted on this channel back in 2023, interest in the Ukrainian track has faded, and the focus has shifted to the Middle East, scaling the conflict to the entire Muslim world. This leads to a global logistical deadlock and an energy shock, a rapid rise in prices for oil/gas/fertilizers/food, where Europe is the main victim. The influx of refugees, hyperinflation of costs, and deindustrialization will lead to the final dismantling of the EU in its current form.
🔵Phase III. The Architecture of the New Order and the Digital Economy
Capital cannot sit forever in bonds yielding 3%. Once the acute phase of the crisis passes, the puppet masters will need a new vacuum cleaner for liquidity. The ultimate goal of all crises is the transition of humanity into a new digital paradigm.
- The Great Debt Migration and the Trojan Horse of Stablecoins:
Since BRICS and Japan are exiting US government debt, the US has shifted its problems onto geopolitical "lackeys" (the UK, Belgium) and small private capital via crypto-dollars (USDT, USDC). A person in Argentina or the CIS buys a stablecoin to escape inflation, and the issuers (Tether, Circle) use that money to buy US Treasury bills. Private capital in developing countries, without even realizing it, is financing America's national debt directly through the blockchain. - Tokenization of the Real World (RWA): The global economy is being aggressively moved onto "digital tracks." The blockchain will become the base foundation for digitizing real assets (real estate, commodities, stocks, government debt). Meanwhile, traditional decentralized fintech (DeFi) will be ruthlessly purged and brought under institutional control via KYC/AML protocols.
- Central Bank Digital Currencies (CBDCs) and Programmable Money: By 2035, cash will be forced out of circulation. The transition to digital dollars and euros will give regulators absolute power over citizens' capital. Programmable money with an expiration date, targeted payouts, personalized negative interest rates, and the instant blocking of unwanted accounts will become the norm.
- Digital ID and AI Automation: With millions of "redundant" workers being freed up due to the implementation of artificial intelligence, the financial circuit will be inextricably linked to digital identification (Digital ID). This system will become the sole mechanism for distributing rations and maintaining order among the impoverished masses.
________________________________________
🏁 Epilogue and Final Conclusions
We stand on the threshold of the greatest redistribution of capital and shift of eras in history. The old financial order, based on a 40-year supercycle of cheap debt, an exponential printing press, and the dominance of the fiat dollar, has definitively exhausted its resource. Attempts to disguise this collapse through Fed verbal interventions and media noise are crumbling under the weight of dry mathematics: servicing the $40 trillion pyramid of US national debt can no longer be sustained within a static model without destroying the system itself.
What the uneducated public habitually labels "accidental crises" or "conspiracy theory" is in reality a strictly calculated, managed dismantling. The architects of the global system fully understand the inevitability of the fiat dollar's collapse. This is precisely why they built a new technical infrastructure well in advance:
- Directed the crowd's capital into funding the AI infrastructure and computational capacities of tomorrow's digital control;
- Turned the stablecoin market (USDT, USDC) into an unspoken offshore vacuum cleaner for the forced absorption of toxic Treasuries;
- Laid the groundwork for the total tokenization of the real world (RWA) and the implementation of programmable money (CBDC).
The curtain is falling on the old financial drama. The "Titanic" of the fiat system is going under, while seats on digital "lifeboats" have already been prepared for first-class passengers and managers. Those who continue to live in the illusion of a "return to the 2019 norm" are paying and will continue to pay for this historical bankruptcy out of their own pockets.
🙏 "Thank you for your attention to this matter." ©
☘️ Good luck, and stay vigilant.
📟 Over and out.

Related publications
Disclaimer
The information and publications are not meant to be, and do not constitute, financial, investment, trading, or other types of advice or recommendations supplied or endorsed by TradingView. Read more in the Terms of Use.
Related publications
Disclaimer
The information and publications are not meant to be, and do not constitute, financial, investment, trading, or other types of advice or recommendations supplied or endorsed by TradingView. Read more in the Terms of Use.