Hunters, keep an eye on the banking sector! 🏦 While the crowd is celebrating earnings, we see an opportunity on the opposite side of the market.
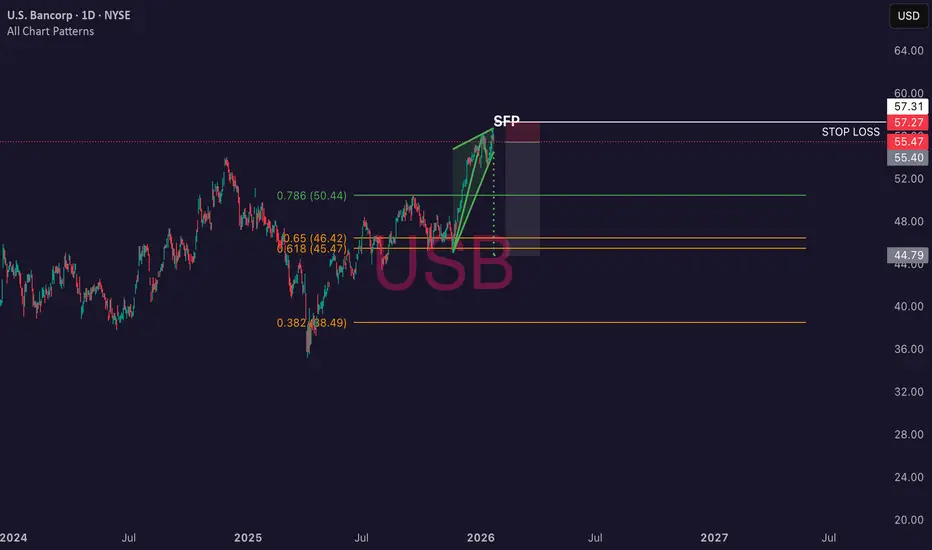
U.S. Bancorp stock ( USB) is trading in a strong resistance zone around the $56 - $57 level (yearly highs). Despite positive news from Q4 earnings, the market is failing to convincingly break through this level, opening the door for a downside speculation.
🔍 Technical Analysis & Reasons for Entry:
Bull Trap / Double Top: The price returned to the highs of December 2025, but we see clear rejection. Candle formations suggest indecision and an inability to sustain higher prices, often leading to a "Double Top" formation.
Overbought (RSI Divergence): On the daily chart, the RSI indicator shows bearish divergence – price made a new (or equal) high, but the oscillator made a lower peak. This is a strong signal of momentum loss.
Institutional Distribution: In the area above $56, we are tracking increased selling activity (insider selling reported in January), suggesting that "smart money" is utilizing retail buyer liquidity to take profits.
📊 Trade Parameters:
Entry: Current Market Price (ideally upon a failure to break $56.50).
Stop Loss: Just above the local swing high (approx. $57.50 - $58.00). If the market breaches this zone with a strong green candle, the setup is invalid.
RRR: Attractive, risking a tight stop loss against a mean reversion move.
This is a trade against current sentiment, so discipline is key. We are betting that the good news is already "priced in" and the market needs a correction.
U.S. Bancorp stock (
USB) is trading in a strong resistance zone around the $56 - $57 level (yearly highs). Despite positive news from Q4 earnings, the market is failing to convincingly break through this level, opening the door for a downside speculation.🔍 Technical Analysis & Reasons for Entry:
Bull Trap / Double Top: The price returned to the highs of December 2025, but we see clear rejection. Candle formations suggest indecision and an inability to sustain higher prices, often leading to a "Double Top" formation.
Overbought (RSI Divergence): On the daily chart, the RSI indicator shows bearish divergence – price made a new (or equal) high, but the oscillator made a lower peak. This is a strong signal of momentum loss.
Institutional Distribution: In the area above $56, we are tracking increased selling activity (insider selling reported in January), suggesting that "smart money" is utilizing retail buyer liquidity to take profits.
📊 Trade Parameters:
Entry: Current Market Price (ideally upon a failure to break $56.50).
Stop Loss: Just above the local swing high (approx. $57.50 - $58.00). If the market breaches this zone with a strong green candle, the setup is invalid.
RRR: Attractive, risking a tight stop loss against a mean reversion move.
This is a trade against current sentiment, so discipline is key. We are betting that the good news is already "priced in" and the market needs a correction.
Trade closed: stop reached

Disclaimer
The information and publications are not meant to be, and do not constitute, financial, investment, trading, or other types of advice or recommendations supplied or endorsed by TradingView. Read more in the Terms of Use.
Disclaimer
The information and publications are not meant to be, and do not constitute, financial, investment, trading, or other types of advice or recommendations supplied or endorsed by TradingView. Read more in the Terms of Use.