

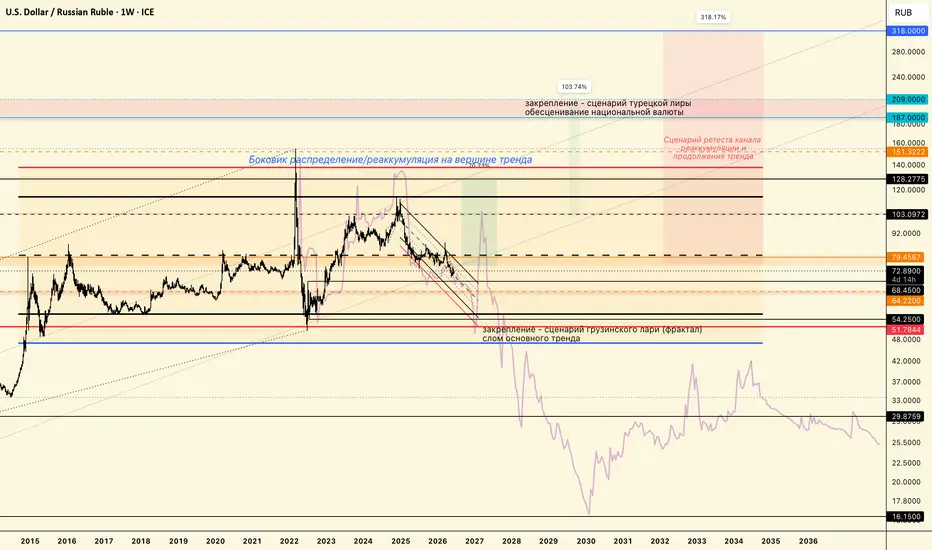
The chart shows the main trend, with a distribution/reaccumulation channel at its top.
The key reversal zones are horizontal levels and liquidity blocks.
The percentages show the potential for medium-term movements in local trends when local structures are broken (downward channel/breakthrough of the horizontal channel of the main trend/continuation of the main trend after a retest).
Also two different low-possibility scenarios if strong break upwards/downwards happens. — "turkish lira"/"georgian lari" scenarios.

Disclaimer
The information and publications are not meant to be, and do not constitute, financial, investment, trading, or other types of advice or recommendations supplied or endorsed by TradingView. Read more in the Terms of Use.
Disclaimer
The information and publications are not meant to be, and do not constitute, financial, investment, trading, or other types of advice or recommendations supplied or endorsed by TradingView. Read more in the Terms of Use.