
WTI Crude Oil — Candle-by-Candle Market Structure Analysis
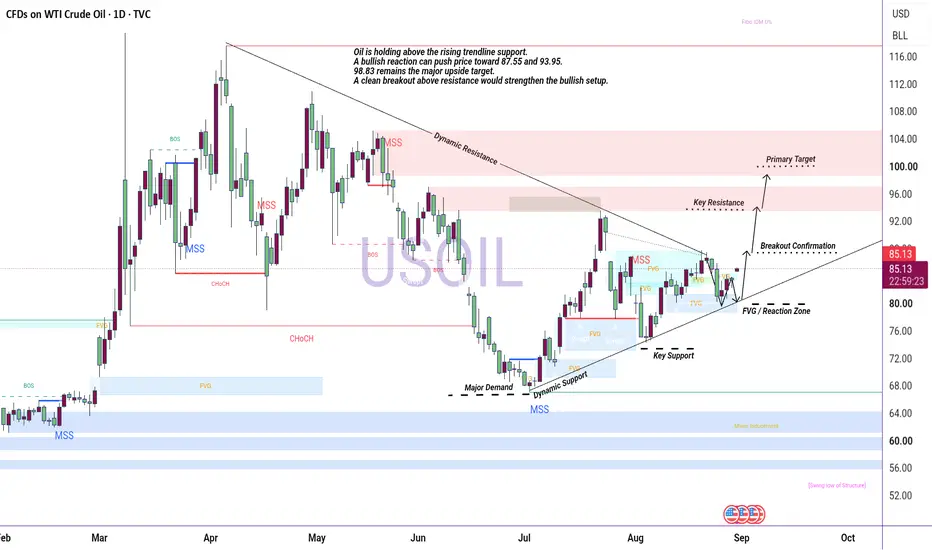
This chart presents a detailed price-action study of WTI Crude Oil using market structure, MSS, BOS, CHoCH, FVGs, liquidity levels, and dynamic trendlines.
The early candles show a period of consolidation followed by a strong bullish expansion. Successive bullish candles created higher highs and higher lows, confirming increasing buying pressure. The BOS signals highlight important structural breaks as price continued to advance.
Around the April high, price reached a major resistance area and started showing signs of rejection. The following candles created lower highs and bearish momentum, leading to multiple MSS and CHoCH confirmations. This shift indicated that sellers had temporarily gained control.
During May and June, bearish candles pushed price lower and gradually formed a broader corrective structure. Price eventually reached the 67.34–74.69 support region, where selling pressure weakened and buyers started defending the area.
From July onward, the candles began forming a recovery structure. Higher lows developed along the rising trendline, while repeated FVG reactions supported the bullish recovery. The recent candles are now consolidating around the 80–87 area, showing a battle between buyers and sellers.
The current setup is focused on the rising dynamic support and nearby FVG reaction zone. A successful bullish continuation and breakout above 87.55 could open the path toward 93.95 and 98.83. The 98.83 area remains an important resistance and primary upside target.
Overall, the chart demonstrates how each candle contributes to the bigger market structure—from consolidation and liquidity sweeps to MSS, BOS, FVG reactions, trendline support, and potential continuation targets.
This analysis is for educational and technical-analysis purposes only, not financial advice.
Trade active
Trade closed manually
Keep strong Hold wait for my last target 
What You'll Get
Daily Forex signals with high accuracy
t.me/+2Bz-lcNYpz04MGM0
fundamental analysis
Risk management tips to
protect your capital
Join now and start winn
t.me/+_drPZUCEV-EyNjlk
Daily Forex signals with high accuracy
t.me/+2Bz-lcNYpz04MGM0
fundamental analysis
Risk management tips to
protect your capital
Join now and start winn
t.me/+_drPZUCEV-EyNjlk
Related publications
Disclaimer
The information and publications are not meant to be, and do not constitute, financial, investment, trading, or other types of advice or recommendations supplied or endorsed by TradingView. Read more in the Terms of Use.