
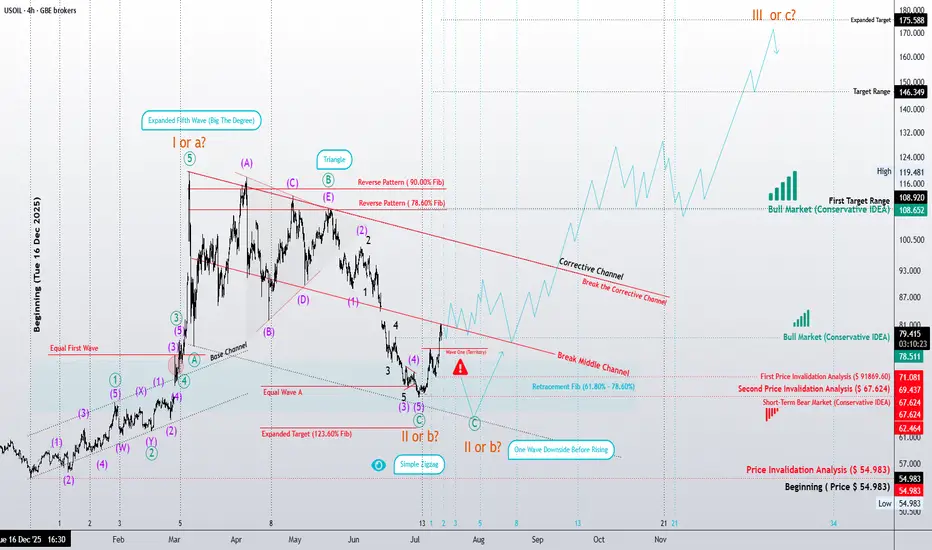
Crude Oil (USOIL) – 4H Elliott Wave Update
Impulse, Diagonal, or a Larger Correction?
The recent decline may have completed either Wave II of a developing bullish cycle or Wave b within a larger corrective structure. At this stage, both interpretations remain valid, and the market has not yet provided enough structural evidence to confirm either scenario.
If the bullish count is correct, the next advance could unfold in more than one form.
The most straightforward scenario is a classic five-wave Impulse. However, Elliott Wave Principle also allows another possibility that deserves careful attention: Wave III itself may develop as a Diagonal.
Depending on how the structure evolves, this diagonal could appear as:
A Leading Diagonal, particularly if it marks the beginning of a larger fifth wave.
An Ending Diagonal if the market gradually loses momentum.
An Extended Ending Diagonal.
A Contracting Ending Diagonal, which currently appears to be the more probable diagonal variation.
In each of these diagonal structures, the internal subdivision would follow the familiar 3-3-3-3-3 sequence rather than the traditional impulsive subdivision.
On the other hand, if geopolitical conditions, supply disruptions, or market psychology suddenly intensify, the advance may instead develop into a powerful classic Impulse, producing a much stronger acceleration than a diagonal would normally suggest.
The projected path shown on this chart represents only a schematic illustration of a possible bullish sequence. It should not be interpreted as the exact path price must follow. As the structure develops, each wave may become more complex and subdivide into additional internal degrees.
For now, the primary objective is much simpler.
The market should first reach the initial target zone and successfully break above the previous Wave B, currently labeled as Wave III on this count. Only after that structural confirmation will higher Fibonacci objectives become increasingly reliable.
Alternative Corrective Interpretation
Another possibility is that the correction is not developing as a Zigzag at all.
Instead, it may be forming a Flat Correction—possibly even an Expanded Flat.
One reason this scenario deserves consideration is that Wave A retraced nearly 90%, behavior that remains consistent with several Flat variations. Although the structure currently appears somewhat irregular, Elliott Wave guidelines recognize that Flats can often develop with a relatively "messy" internal appearance.
If this interpretation proves correct, the equality relationships between corrective waves may become more reliable than extended Fibonacci projections during the early stages of the new advance. Until the market clearly reveals the character of the next motive structure, these proportional relationships deserve close attention.
The Conservative Scenario Remains on the Table
Despite the increasing probability of a bullish reversal, the conservative scenario shared in my previous long-term analysis remains completely valid.
Under that interpretation, the entire decline may still represent only Wave (II) of a larger degree, unfolding as a Classic Zigzag before the next long-term bullish cycle begins.
For those interested in the broader context, I encourage reviewing my previous long-term Crude Oil analysis, where this conservative roadmap is discussed in greater detail.
Final Thoughts
At this stage, the objective is not to predict the exact path of the market.
It is to recognize the structures that remain valid, identify the levels that confirm or invalidate each scenario, and allow price action to reveal the true character of the developing trend.
Sometimes the market advances through a clean Impulse.
Sometimes it progresses through a slow and overlapping Diagonal.
The difference is not only in price—it is in the character of the wave.
Patterns whisper. I listen.
— Mr. Nobody

Related publications
Disclaimer
The information and publications are not meant to be, and do not constitute, financial, investment, trading, or other types of advice or recommendations supplied or endorsed by TradingView. Read more in the Terms of Use.
Related publications
Disclaimer
The information and publications are not meant to be, and do not constitute, financial, investment, trading, or other types of advice or recommendations supplied or endorsed by TradingView. Read more in the Terms of Use.