
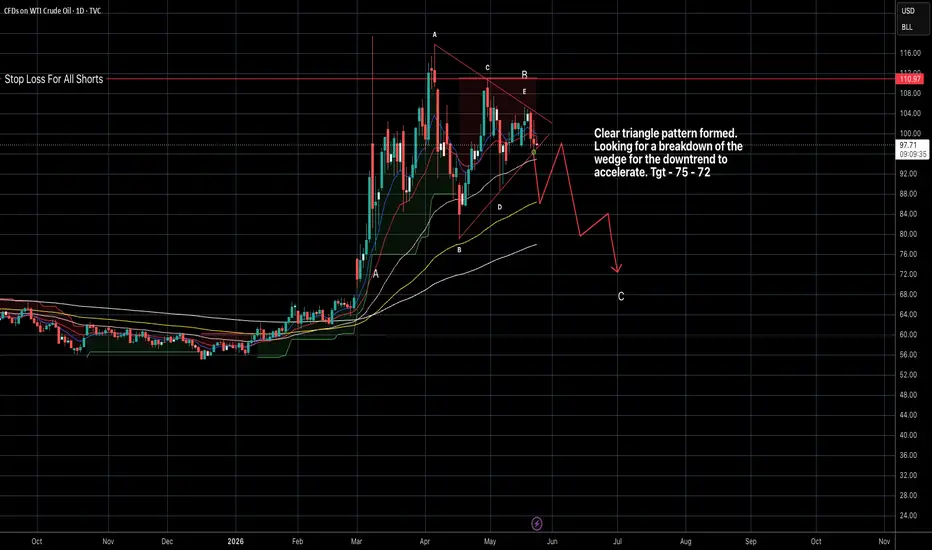
The US Oil chart formed its high on the 9th of March and has been in a sideways corrective since then. The chart clearly shows that Wave A of the corrective was quick and strong, making a low of 76 (from a high of 119) within a day. Following this move, Wave B began its upward/sideways journey in the form of a triangle (which usually follows such quick and strong moves) The market has been slotted and has completed a perfect triangle pattern ending on the 18th of May. The final C wave is now pending providing traders with a great opportunity as we have a defined stop loss and a high probability of a quick downside move back to 75 levels.

Elliot Wave Analyst - 15 years Experience || For detailed charts check out and join my SKOOL community - skool.com/investoredgeclub/about
Disclaimer
The information and publications are not meant to be, and do not constitute, financial, investment, trading, or other types of advice or recommendations supplied or endorsed by TradingView. Read more in the Terms of Use.