
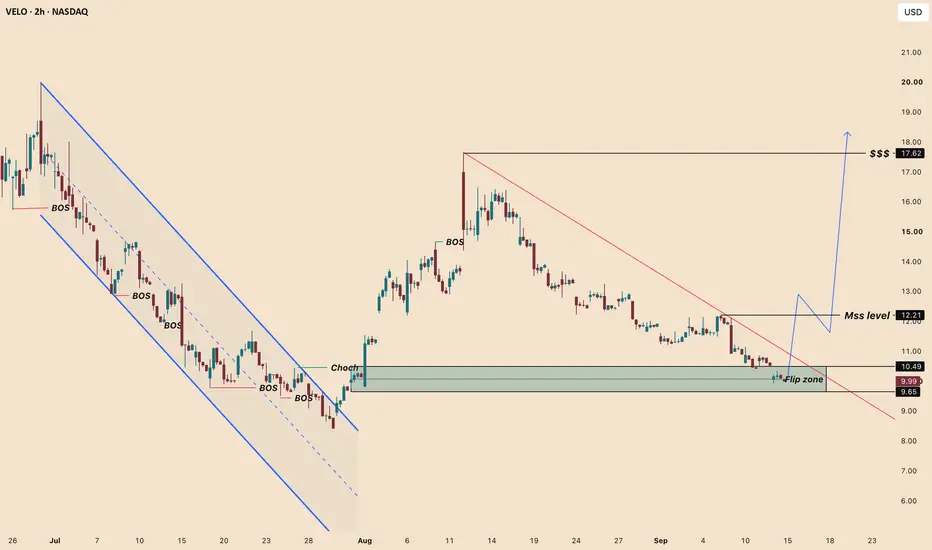
By analyzing the #VELO (Velo3D, Inc.) chart on the 2H timeframe, we can see a market that spent June and July grinding lower inside a clean descending channel, broke out of it, and is now pressing back into the first area that decides whether the breakout was real.
2H Timeframe
The June to late July leg was one-directional: four consecutive BOS lower, every swing low taken out, price contained inside the descending channel the entire way down. The turn came in late July with a CHoCH at $10.49 — the first upside break of structure in the whole move — followed by a BOS at $15.00 that confirmed it and carried price to $17.62.
What followed was the correction, not a new downtrend. From $17.62 price has drifted lower under a descending trendline since mid-August, printing lower highs into the same zone it originally broke out of. That zone is the Flip Zone at $9.65 – $10.49 — old resistance, now the first demand being retested. Price sits at $9.99, inside it.
Above, the liquidity is stacked: the MSS level at $12.21 sits directly beneath the descending trendline, and the resting liquidity at $17.62 is the origin high that has never been revisited.
The Bias
Bullish while the Flip Zone holds, neutral the moment it does not.
Scenario A — the base case.
Price reacts out of the Flip Zone ($9.65 – $10.49), reclaims the descending trendline, and the confirmation is a 2H close above $12.21. That close breaks the MSS level and the trendline in the same move, which is the structural green light. Target is the resting liquidity at $17.62.
Scenario B — the deeper sweep.
Price wicks beneath the Flip Zone to take the liquidity under $9.65, then closes back inside. Same destination, better entry — but it still requires the $12.21 close to confirm. Nothing changes about the objective, only the price at which the position gets built.
Invalidation. A 2H close below $9.65 with no reclaim. At that point the Flip Zone has failed as demand and the entire breakout structure from late July is back in question.
And the rule that governs all of it: a break is a candle close, not a wick. The $12.21 level is exactly where a wick through the trendline will look like a breakout and close back beneath it — the MSS level and the descending trendline intersecting in the same area is where stops cluster, and clustered stops are what wicks are built from.
Fundamental Backdrop
The operating numbers have turned. Q2 2026 revenue came in at $20.7M, up 52.3% year over year, with gross margin at 21.5% — up from 7.5% in Q1 2025. Management raised full-year guidance to $65M – $75M and is guiding gross margin above 30% in H2 2026 alongside positive EBITDA. Debt was cut roughly 70% to about $9M after a $15M debt-to-equity conversion, and the new 289,000 sq ft Livermore Production Campus is built to triple capacity. Inclusion in the Russell 3000 in June added a passive bid.
The other side is real. The company is still unprofitable — net loss of $51.59M on trailing revenue of $57.56M — and cash fell to $16.6M as of March 31, 2026 from $39.0M at year-end, against planned capex of $40M – $50M. That is a funding gap that likely gets closed with dilution, and the stock is up over 400% on market cap, meaning a great deal of the turnaround is already priced.
Which is why the structure matters more than the story here. The fundamentals justify why buyers defend the Flip Zone. They do not justify buying before $12.21 closes.
This analysis will be updated as the market evolves.
Best Regards, BigBeluga 🐳
Trade active
UPDATEThe Flip Zone did its job.
The original idea put the whole case on one area: the Flip Zone at $9.65 – $10.49, with two routes out of it — react directly, or sweep the liquidity beneath $9.65 first and close back inside. Invalidation was a 2H close below $9.65 with no reclaim.
Price took the second route. It traded down into the zone in mid-September, dipped beneath $9.65 intraday, and closed back inside — the sweep, not the failure. From there it reversed and has expanded to $11.27, back above the descending trendline that had capped every rally since mid-August.
What has not happened yet. The large move has not been confirmed. The confirmation was never the reaction — it was a 2H close above the MSS level at $12.21, and that close has not printed. Price is still trading beneath it. Until that level breaks on a close, this is a reaction inside the range, not a structural break, and the objective at $17.62 stays untouched and unearned.
Worth being straight about this: the zone delivered exactly what it was supposed to deliver, and that is all it was supposed to deliver. The reaction was the condition, not the objective. The move that opens $17.62 begins above $12.21, not below it.
What is still true. The Flip Zone at $9.65 – $10.49 held as demand and is now proven rather than assumed. The MSS level at $12.21 is still the line that separates a bounce from a trend. Invalidation is unchanged: a 2H close below $9.65 with no reclaim.
And the rule has not changed: a break is a candle close, not a wick. The wick beneath $9.65 was precisely the event the original post said to expect there — anyone who treated it as invalidation was stopped out of the move that followed.
Updated chart:

🌐 bigbeluga.org/tv - Get access to our powerful tools & indicators.
🔵 Learn More -> docs.bigbeluga.org/
🔵 Join Discord -> go.bigbeluga.org/k65q9bfqfu
All content provided by BigBeluga is for educational purposes only
🔵 Learn More -> docs.bigbeluga.org/
🔵 Join Discord -> go.bigbeluga.org/k65q9bfqfu
All content provided by BigBeluga is for educational purposes only
Disclaimer
The information and publications are not meant to be, and do not constitute, financial, investment, trading, or other types of advice or recommendations supplied or endorsed by TradingView. Read more in the Terms of Use.