
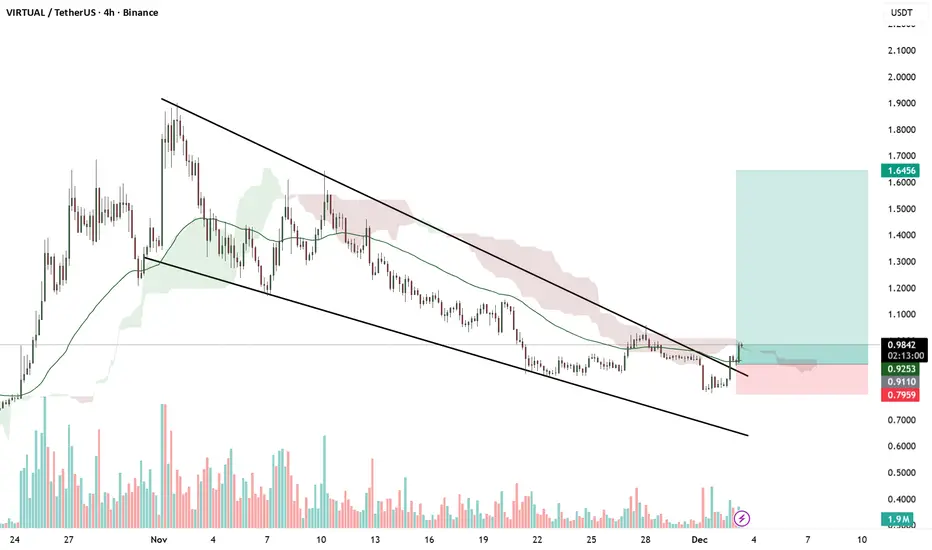
On the 4-hour chart of **VIRTUAL/USDT**, price has been moving inside a clear **descending channel** since mid-November, making lower highs and lower lows. Recently, price rebounded from the lower trendline and is now testing the upper boundary of the channel near **$0.98–$1.00**. The candle structure shows that bulls are trying to break out of this channel, but price is still facing resistance from both the **Ichimoku Cloud** and the **EMA trendline**, which are acting as dynamic resistance levels. A confirmed breakout and 4H candle close above **$1.00–$1.05** would indicate a possible trend reversal toward **$1.20–$1.30**, while rejection from this zone could lead to another decline toward the **$0.85–$0.80** support area. Volume has increased slightly on the recent upward move, showing early buying pressure, but a clean breakout confirmation is still needed for strong bullish continuation.

SpyOnGems (Mayank) | Technical Analysis & Education | Telegram: t.me/spyongems
Disclaimer
The information and publications are not meant to be, and do not constitute, financial, investment, trading, or other types of advice or recommendations supplied or endorsed by TradingView. Read more in the Terms of Use.