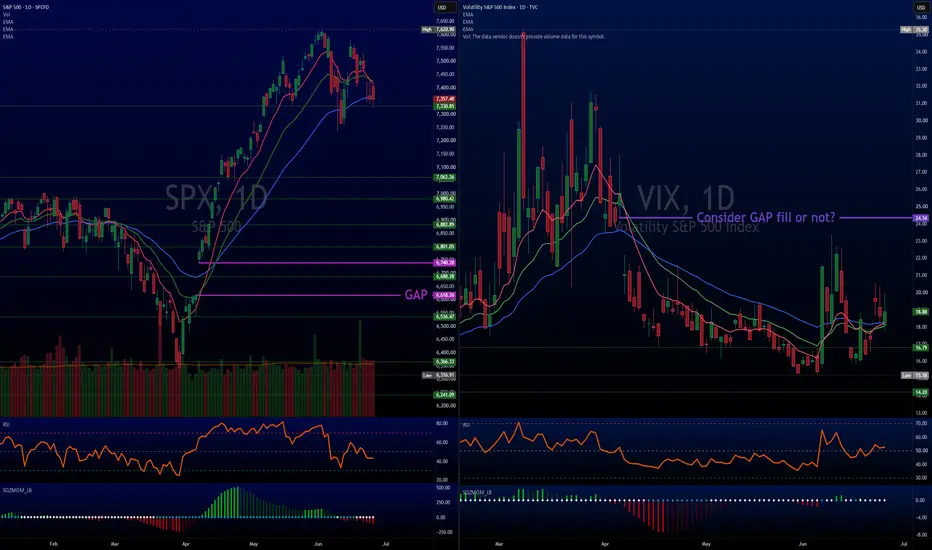
While retail traders chase daily headlines, look at the pure physics of the current market structure. We are experiencing a textbook volatility compression cycle coupled with an aggressive under the surface capital migration.
1. The Macro Squeeze Alignment
If you look across your daily layouts, a rare phenomenon is occurring: SPX,
 NDX,
 DJI,
 SOX, and the
 VIX are all locked in a tight TTM Squeeze simultaneously.
The market has ground to a halt. Price energy is being tightly coiled inside the Bollinger Bands and Keltner Channels. However, the internal mechanics tell an interesting story:
•The Indices: While price churns near support lines (like daily EMA), the momentum histograms are steadily losing upward velocity.
•The VIX: The selling of volatility has exhausted its downward momentum wave, and the daily RSI is quietly printing a string of higher lows.
When major equity indices lose steam while volatility finishes its downward cycle, the math warns chartists to be highly cautious. A market wide expansion wave is cooking, and the path of least resistance is testing critical floors.
2. Mapping the Institutional Rotation
Money doesn't simply vanish during a high beta growth cooldown; it migrates to "safe harbors". If you track the tape, institutional portfolio managers are actively rotating away from tech/chip fatigue and parking capital into other zones:
•The Biotech & Genomics Hybrid Growth Anchor: Vehicles like the VanEck Biotech ETF (BBH) are absorbing capital, alongside high sentiment genomics names like NTLA,
 TEM, and $CRSP.
•Classic Mega-Cap Defensive Staples: Heavy capital is actively flowing into defensive cash-cow shields like UnitedHealth UNH, Medtronic
 MDT, Kimberly Clark
 KMB, and Clorox $CLX.
Conversely, the market is being highly selective and leaving behind specific names like PepsiCo PEP, showing that this is a targeted, professional flight to structural strength rather than a blind value rally.
The Trading Blueprint
When the entire market coils into a squeeze, the worst thing a trader can do is get chopped to pieces trying to trade mid-range intraday wiggles.
1.Protect your near-term capital from sudden downside uncoiling.
2.Let the white dots flip to a fresh directional expansion wave.
3.Keep a close eye on the weekly charts to find the ultimate "line in the sand" structural floors.
Trade the reality on the screen, not the noise in the news.
1. The Macro Squeeze Alignment
If you look across your daily layouts, a rare phenomenon is occurring:
SPX, NDX, DJI, SOX, and the VIX are all locked in a tight TTM Squeeze simultaneously.The market has ground to a halt. Price energy is being tightly coiled inside the Bollinger Bands and Keltner Channels. However, the internal mechanics tell an interesting story:
•The Indices: While price churns near support lines (like daily EMA), the momentum histograms are steadily losing upward velocity.
•The VIX: The selling of volatility has exhausted its downward momentum wave, and the daily RSI is quietly printing a string of higher lows.
When major equity indices lose steam while volatility finishes its downward cycle, the math warns chartists to be highly cautious. A market wide expansion wave is cooking, and the path of least resistance is testing critical floors.
2. Mapping the Institutional Rotation
Money doesn't simply vanish during a high beta growth cooldown; it migrates to "safe harbors". If you track the tape, institutional portfolio managers are actively rotating away from tech/chip fatigue and parking capital into other zones:
•The Biotech & Genomics Hybrid Growth Anchor: Vehicles like the VanEck Biotech ETF (BBH) are absorbing capital, alongside high sentiment genomics names like
NTLA, TEM, and $CRSP.•Classic Mega-Cap Defensive Staples: Heavy capital is actively flowing into defensive cash-cow shields like UnitedHealth
UNH, Medtronic MDT, Kimberly Clark KMB, and Clorox $CLX.Conversely, the market is being highly selective and leaving behind specific names like PepsiCo
PEP, showing that this is a targeted, professional flight to structural strength rather than a blind value rally.The Trading Blueprint
When the entire market coils into a squeeze, the worst thing a trader can do is get chopped to pieces trying to trade mid-range intraday wiggles.
1.Protect your near-term capital from sudden downside uncoiling.
2.Let the white dots flip to a fresh directional expansion wave.
3.Keep a close eye on the weekly charts to find the ultimate "line in the sand" structural floors.
Trade the reality on the screen, not the noise in the news.
Trade active
See our recent posts
Disclaimer
The information and publications are not meant to be, and do not constitute, financial, investment, trading, or other types of advice or recommendations supplied or endorsed by TradingView. Read more in the Terms of Use.
Disclaimer
The information and publications are not meant to be, and do not constitute, financial, investment, trading, or other types of advice or recommendations supplied or endorsed by TradingView. Read more in the Terms of Use.