
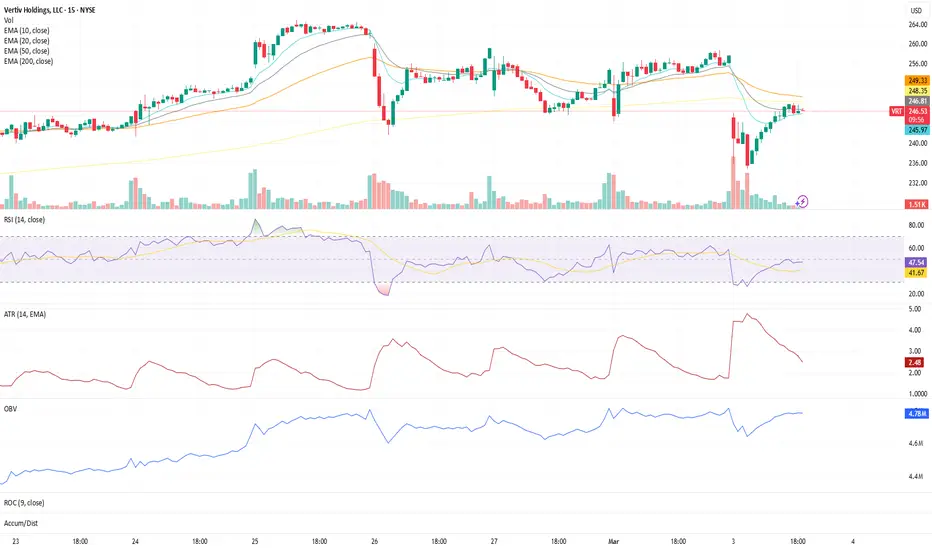
Today’s open gave us a good educational example.
Price mapped lower immediately at the bell — sharp red candle, elevated volume, momentum spike lower.
At first glance, that looks like aggressive selling.
But lower timeframes tell a different story when read correctly.
What Happened at the Open
• Gap down
• Initial impulse lower
• Volume expansion
• RSI washed out
• ATR expanded
This is emotional order flow.
What matters is not the first candle.
What matters is what happens after the first candle.
The Key Question
Is this continued supply…
or emotional liquidation that gets absorbed?
On the 5m chart:
• No repeated heavy supply waves
• Higher lows began forming
• Volume tapered after the initial flush
• Short-term EMAs began smoothing
• Price gradually reclaimed its opening reference
That is stabilization behavior.
Not distribution.
Important Distinction
Distribution is not defined by a single candle.
Distribution shows:
• Repeated failed bounces
• Expanding red volume on every push down
• Lower highs stacking
• Participation deteriorating
That did not occur here.
Instead, price began climbing back toward its opening reference — a common intraday behavior when early emotion exhausts without follow-through.
Framework Reminder
Lower timeframes are not for predicting trend.
They are for measuring response.
The daily defines structure.
The intraday defines character.
Today’s character:
Emotional flush → absorption → controlled recovery.
Structure > Emotion.
⭐ Final Clarity Note ⭐
The open does not define the day.
Reaction defines the participants.
When panic exhausts without follow-through, it often reveals more about positioning than headlines ever will.

Disclaimer
The information and publications are not meant to be, and do not constitute, financial, investment, trading, or other types of advice or recommendations supplied or endorsed by TradingView. Read more in the Terms of Use.
Disclaimer
The information and publications are not meant to be, and do not constitute, financial, investment, trading, or other types of advice or recommendations supplied or endorsed by TradingView. Read more in the Terms of Use.