VTL: Breakout - retest - Continuation?The chart is self-explanatory as always :)
Want to request a specific analysis? Check our bio for details.
⚠️Disclaimer: We are not registered advisors. The views expressed here are merely personal opinions. Irrespective of the language used, Nothing mentioned here should be considered as advice
20.75INR
7.95 BINR
99.53 BINR
102.98 M
About VARDHMAN TEXTILES
Sector
Industry
Headquarters
Ludhiana
Website
Employees (FY)
28.28 K
Founded
1965
ISIN
INE825A01020
FIGI
BBG000CW10M9
Vardhman Textiles Ltd. engages in the manufacture, purchase, and sale of textiles. Its products includes cotton yarn, synthetic yarn, woven fabric, sewing thread and acrylic fiber. The company was founded by Lala Rattan Chand Oswal in 1965 and is headquartered in Ludhiana, India.

VTL- AnalysisFor 3-6 Months
Entry above 430
Conservative traders above 455
Stop loss Closing below - 370 or 365
Expected Targets -450 to 455 , 540 to 548 then 637 to 650
Please do your due diligence before trading or investment.
*Comment or message me if you wish to see my analysis for any stocks.
**Dis

VTL SWING TRADE IDEA VTL gave resistance trend line breakout with gud volume bar and strong bullish candle breaching weekly resistance zone can play for swing trade with your prefered RR.


VTL Ascending TriangleAbove 380
Ascending Triangle will be break,
Target 430, 477
SL: 368
Risk is yours and Reward is too yours
Time Frame : 3 months

VTL(vardhman textiles)VTL is looking good for long run, it has ability to travel till 550 after the successfully crossing of 440. But as we are looking for short term there also good opportunity with small sl of 12 with the target of almost double.

VTL: Positional BuyNSE:VTL Weekly chart showing positive formation exactly from weekly bottom averages. Also looks like rounding formation.

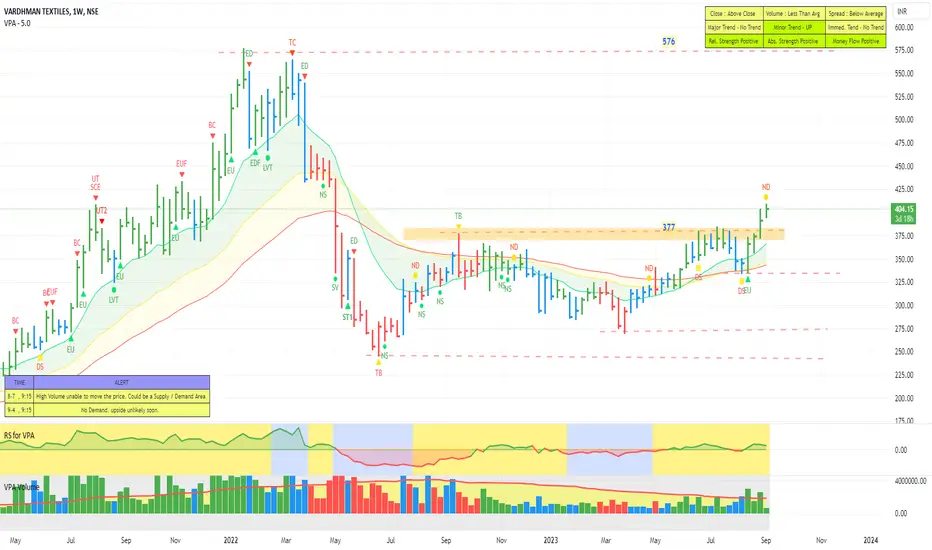
VTL - Ready to Move up The stock after a reversal is on recovery mode. Now making a Higher High and Higher Lows on Weekly and now on Daily as well. Relative Strength, Absolute Strength and Money flow all positive. The Stock looks strong to move up further and likely to test 576 levels.
VTL BREAKOUTBreakout in VTL with huge volume, if sustains 374 then 450-500 possible in short to medium term and stock pe is 18 , roe 11.33%, market cap 10000cr

Sellers is having Upper Hand !Hello @bhikhu65
As requested by you here what I see in this chart,
Strong Downtrend and it Downzone is may be deep
Up move is only expected 380 on Weekly Closing basis (as Rejection zone is 350-380)
Below Support Zone is near 245 and Price is testing this level is only once,
so my my expectat

See all ideas
Trade directly on the supercharts through our supported, fully-verified and user-reviewed brokers.


Frequently Asked Questions
The current price of VTL is 462.90 INR — it has decreased by 1.68% in the past 24 hours.
Depending on the exchange, the stock ticker may vary. For instance, on NSE exchange VARDHMAN TEXTILES stocks are traded under the ticker VTL.
VARDHMAN TEXTILES is going to release the next earnings report on May 10, 2024. Keep track of upcoming events with our Earnings Calendar.
VTL stock is 2.17% volatile and has beta coefficient of 0.34. Check out the list of the most volatile stocks — is VARDHMAN TEXTILES there?
One year price forecast for VARDHMAN TEXTILES has a max estimate of 469.00 INR and a min estimate of 418.00 INR.
VTL earnings for the last quarter are 4.70 INR whereas the estimation was 4.89 INR which accounts for −3.79% surprise. Estimated earnings for the next quarter are 5.00 INR. See more details about VARDHMAN TEXTILES earnings.
VARDHMAN TEXTILES revenue for the last quarter amounts to 23.98 B INR despite the estimated figure of 24.06 B INR. In the next quarter revenue is expected to reach 23.90 B INR.
Yes, you can track VARDHMAN TEXTILES financials in yearly and quarterly reports right on TradingView.
VTL stock has fallen by 0.37% compared to the previous week, the month change is a 8.47% rise, over the last year VARDHMAN TEXTILES has showed a 47.56% increase.
VTL net income for the last quarter is 1.60 B INR, while the quarter before that showed 1.34 B INR of net income which accounts for 19.31% change. Track more VARDHMAN TEXTILES financial stats to get the full picture.
Today VARDHMAN TEXTILES has the market capitalization of 134.87 B, it has increased by 1.02% over the last week.
Yes, VTL dividends are paid annually. The last dividend per share was 3.50 INR. As of today, Dividend Yield (TTM)% is 0.75%. Tracking VARDHMAN TEXTILES dividends might help you take more informed decisions.
VARDHMAN TEXTILES dividend yield was 1.19% in 2022, and payout ratio reached 12.52%. The year before the numbers were 1.56% and 12.46% correspondingly. See high-dividend stocks and find more opportunities for your portfolio.
Like other stocks, VTL shares are traded on stock exchanges, e.g. Nasdaq, Nyse, Euronext, and the easiest way to buy them is through an online stock broker. To do this, you need to open an account and follow a broker's procedures, then start trading. You can trade VARDHMAN TEXTILES stock right from TradingView charts — choose your broker and connect to your account.
As of Apr 19, 2024, the company has 28.28 K employees. See our rating of the largest employees — is VARDHMAN TEXTILES on this list?
Investing in stocks requires a comprehensive research: you should carefully study all the available data, e.g. company's financials, related news, and its technical analysis. So VARDHMAN TEXTILES technincal analysis shows the buy rating today, and its 1 week rating is buy. Since market conditions are prone to changes, it's worth looking a bit further into the future — according to the 1 month rating VARDHMAN TEXTILES stock shows the buy signal. See more of VARDHMAN TEXTILES technicals for a more comprehensive analysis.
If you're still not sure, try looking for inspiration in our curated watchlists.
If you're still not sure, try looking for inspiration in our curated watchlists.
We've gathered analysts' opinions on VARDHMAN TEXTILES future price: according to them, VTL price has a max estimate of 469.00 INR and a min estimate of 418.00 INR. Read a more detailed VARDHMAN TEXTILES forecast: see what analysts think of VARDHMAN TEXTILES and suggest that you do with its stocks.
EBITDA measures a company's operating performance, its growth signifies an improvement in the efficiency of a company. VARDHMAN TEXTILES EBITDA is 9.32 B INR, and current EBITDA margin is 12.34%. See more stats in VARDHMAN TEXTILES financial statements.