
If you want to understand how I achieve risk-to-reward ratios of 5, 10, or higher — something you’ve probably seen in many of my analyses — stay with me until the end. 🍵
I’ll explain this step by step, directly, and without unnecessary complexity.
Step 1: Fix Your Expectations First 🔧🧠
Before anything else, your expectations must be corrected.
If you expect to trade with an average R:R of 5 and maintain an 80% win rate, you should stop reading right now. That mindset is fundamentally flawed.
Profitability does not require a high win rate. ❌

For example:
That means out of 100 trades, you only need 20 winners — and you must be mentally prepared for 80 stop losses.
This brings us to a concept that is rarely discussed properly: losing streaks. 📉

If your numbers are significantly different from this, your journal needs review — not your strategy.
Once expectations are realistic, we can move forward.
Step 2: The Art of the Range 🎨
Personally, I love ranges :)
Why?
Because ranges accumulate liquidity — and liquidity eventually fuels strong, impulsive moves.
Do we trade inside the range?
Absolutely not.
You don’t want to become liquidity for others.
We trade the break — either the top or the bottom of the range.
Is it that simple? No.
Let’s walk through a real example.

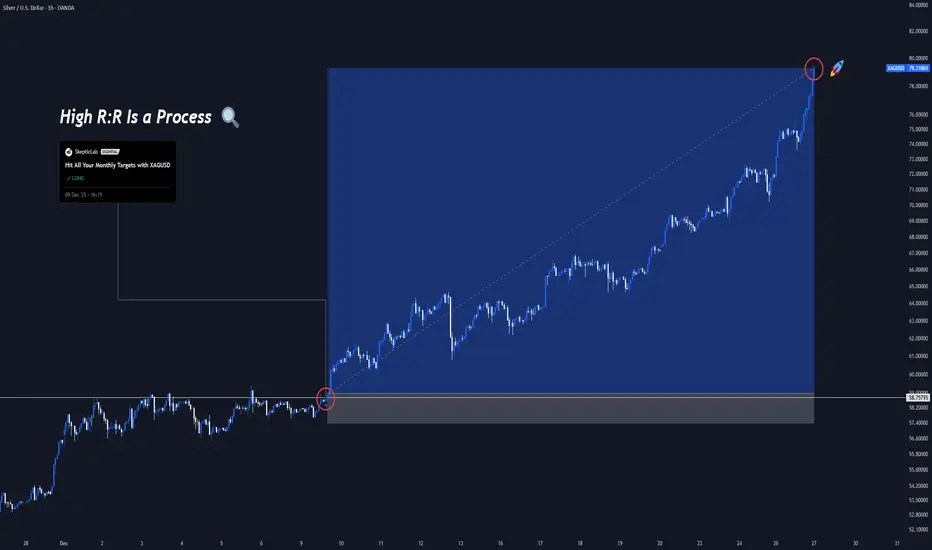
On December 9, in my XAGUSD analysis on the 1H timeframe, price entered a range after a clear impulsive leg up.
Both HWC and MWC structures remained bullish, with higher lows forming inside the range.
Momentum favored buyers.
Candles were stronger on the upside.
Even fundamentals supported silver.
In this case, I waited for a break of the range high, not the low — because all parameters aligned with continuation.
When the breakout candle appeared, the position was opened.
At this point, execution paths may differ:
In my case, I placed the stop below the lower wick of the breakout candle.
Why?
Because seller presence was visible, yet buyers absorbed it aggressively.
The liquidity below that wick made it statistically difficult for price to return there.
This is where trade quality increases — and high R:R becomes possible.
Step 3: Where the Real Edge Is Built 🧙♂️
This is where most traders struggle: when to exit.
I almost always use partial profit-taking — especially when HWC, MWC, and even LWC structures remain bullish.
Closing too early is a mistake.
Instead:
At that point, experience and market reading matter more than rules.
(Reviewing your Personal Trading journal after 100 trades or more, helps you clearly understand how to read the market better.)
If you have questions, leave them in the comments — I’ll respond.
By the way, I’m Skeptic, founder of Skeptic Lab.
I focus on long-term performance through psychology, data-driven thinking, and tested processes.
If this was useful, feel free to support it. 🩵
More education continues tomorrow.
Peace out.
— Skeptic
I’ll explain this step by step, directly, and without unnecessary complexity.
Step 1: Fix Your Expectations First 🔧🧠
Before anything else, your expectations must be corrected.
If you expect to trade with an average R:R of 5 and maintain an 80% win rate, you should stop reading right now. That mindset is fundamentally flawed.
Profitability does not require a high win rate. ❌
For example:
- With an R:R of 2, a win rate of around 40% can already be profitable.
- With an R:R of 5, profitability requires only about a 20% win rate.
That means out of 100 trades, you only need 20 winners — and you must be mentally prepared for 80 stop losses.
This brings us to a concept that is rarely discussed properly: losing streaks. 📉
A losing streak means taking multiple stop losses in a row during a trading period
- With a 40% win rate (R:R 2), a losing streak of 4 trades is statistically normal.
- With a 20% win rate (R:R 5), losing streaks of 9 trades are expected.
If your numbers are significantly different from this, your journal needs review — not your strategy.
Once expectations are realistic, we can move forward.
Step 2: The Art of the Range 🎨
Personally, I love ranges :)
Why?
Because ranges accumulate liquidity — and liquidity eventually fuels strong, impulsive moves.
Do we trade inside the range?
Absolutely not.
You don’t want to become liquidity for others.
We trade the break — either the top or the bottom of the range.
Is it that simple? No.
Let’s walk through a real example.
On December 9, in my XAGUSD analysis on the 1H timeframe, price entered a range after a clear impulsive leg up.
Both HWC and MWC structures remained bullish, with higher lows forming inside the range.
Momentum favored buyers.
Candles were stronger on the upside.
Even fundamentals supported silver.
In this case, I waited for a break of the range high, not the low — because all parameters aligned with continuation.
When the breakout candle appeared, the position was opened.
At this point, execution paths may differ:
- Some place stops below the previous range low.
- Others place them behind the breakout candle.
In my case, I placed the stop below the lower wick of the breakout candle.
Why?
Because seller presence was visible, yet buyers absorbed it aggressively.
The liquidity below that wick made it statistically difficult for price to return there.
This is where trade quality increases — and high R:R becomes possible.
Step 3: Where the Real Edge Is Built 🧙♂️
This is where most traders struggle: when to exit.
I almost always use partial profit-taking — especially when HWC, MWC, and even LWC structures remain bullish.
Closing too early is a mistake.
Instead:
- Close 35% at R:R 2 → the trade becomes risk-free.
- Close 40% at R:R 5 → another R:R 2 is secured.
- Close 20% at R:R 10 → yet another layer of edge.
- Beyond R:R 10, exits depend on:
- Momentum weakness
- Candle rejection
- Structural changes based on Dow Theory
At that point, experience and market reading matter more than rules.
(Reviewing your Personal Trading journal after 100 trades or more, helps you clearly understand how to read the market better.)
If you have questions, leave them in the comments — I’ll respond.
By the way, I’m Skeptic, founder of Skeptic Lab.
I focus on long-term performance through psychology, data-driven thinking, and tested processes.
If this was useful, feel free to support it. 🩵
More education continues tomorrow.
Peace out.
— Skeptic

Related publications
Disclaimer
The information and publications are not meant to be, and do not constitute, financial, investment, trading, or other types of advice or recommendations supplied or endorsed by TradingView. Read more in the Terms of Use.
Related publications
Disclaimer
The information and publications are not meant to be, and do not constitute, financial, investment, trading, or other types of advice or recommendations supplied or endorsed by TradingView. Read more in the Terms of Use.