
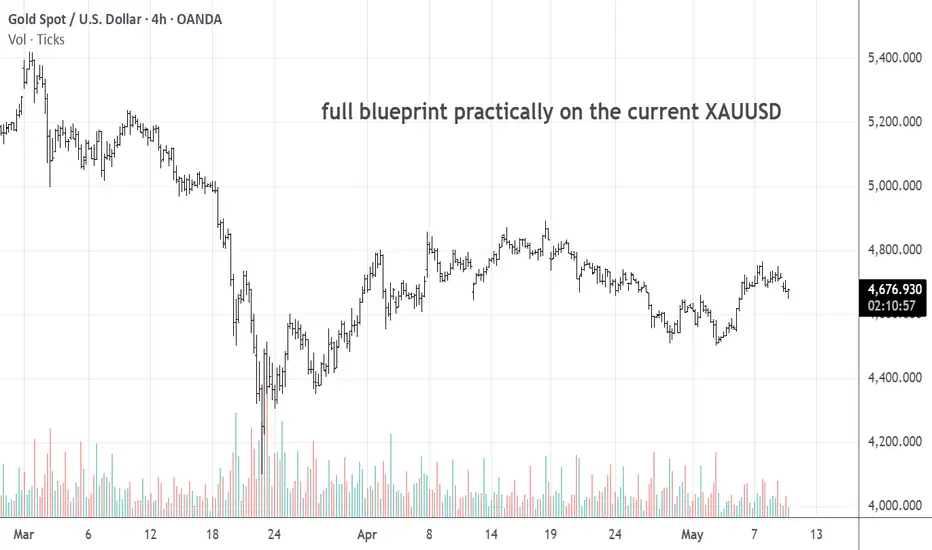
XAUUSD Candlestick Analysis Blueprint
How Professional Gold Traders Actually Read a Chart Before Entering a Trade
This blueprint is written specifically for serious XAUUSD traders who want to understand how professional traders actually read candlestick charts before committing money to a trade.
This is not a signal post. It is not financial advice. It is a practical guide for understanding context, location, confirmation, and risk in the Gold market.
--------------------------------------------------
Professional Timeframe Workflow
--------------------------------------------------
1. Gold Is Not Just Another Forex Pair
Before reading candlesticks on XAUUSD, a trader must understand the instrument itself.
Gold is quoted against the U.S. dollar, but it does not behave like a normal currency pair. EURUSD can grind slowly for hours. Gold can stay quiet for half a session and then move aggressively in a few minutes. GBPUSD can be volatile, but XAUUSD has a different kind of violence. It often runs obvious highs and lows, rejects levels with deep wicks, and reacts sharply to U.S. yields, the dollar, inflation data, central-bank expectations, and risk sentiment.
That is why a setup copied from a normal Forex pair often fails on Gold. A stop loss that looks reasonable on EURUSD may be too tight on XAUUSD. A candle that looks huge on another pair may be normal breathing room on Gold.
Gold respects levels, but not politely. It may break above resistance, pull in breakout buyers, trigger stops from early sellers, and then collapse back below the level. It may break below support, scare buyers out, invite fresh shorts, and then reclaim the same level aggressively.
Professional Gold traders therefore ask one main question around every important level:
Acceptance means price breaks a level and holds beyond it. A raid means price only breaks the level long enough to trigger orders, then returns back inside the previous structure.
That difference is everything.
--------------------------------------------------
2. A Professional Does Not Start on M5
Most struggling traders open the M5 chart first. They see Gold moving, draw a quick line near current price, and start hunting for an entry. The chart feels alive, so they feel they must act.
A professional usually does the opposite.
They zoom out first.
The reason is simple: a lower-timeframe candle does not carry enough meaning by itself. A bullish M5 candle at a Daily demand zone may matter. A bullish M5 candle directly into Weekly supply may be a trap. A bearish M15 candle after a liquidity sweep may be powerful. The same candle in the middle of an H1 range may be useless.
The candle does not create the meaning. The location creates the meaning.
This is why top-down analysis matters.
When beginners lose money on Gold, it is often because they allow the entry timeframe to become the decision timeframe. M5 becomes the boss. One green candle means buy. One red candle means sell. That is not analysis. That is reaction.
--------------------------------------------------
3. Monthly Chart: The Big Weather
The Monthly chart is not where an intraday trader enters, but it tells the market weather.
If Gold is pushing into a historical high after several strong monthly candles, you must know that. The market may still go higher, but buying late into a stretched monthly area is very different from buying a pullback in the middle of a healthy trend.
If Gold has rejected the same monthly zone several times, that matters too. A lower-timeframe long setup may still work, but the trader should be more careful with targets.
On Monthly, a professional checks:
The Monthly chart is not used for entry. It is used to avoid danger. If price is pressing into a huge monthly resistance area, a professional does not blindly buy every M15 breakout. If price is holding above a major monthly support, a professional does not aggressively short every small red candle.
Monthly tells whether the market is fresh, stretched, or near an area where bigger players may care.
--------------------------------------------------
4. Weekly Chart: Where Bigger Money Leaves Footprints
The Weekly chart is where professional Gold traders begin to see the larger swing structure.
On Weekly, the focus is not every small candle. The focus is obvious highs and lows that serious traders would notice:
Gold often reacts around previous weekly highs and lows because liquidity sits there. Traders place stops around those levels. Breakout traders place orders there. Sellers defend highs. Buyers defend lows.
But the professional does not trade the level blindly. The professional watches the reaction.
If Gold runs above last week's high and immediately closes back below it, the breakout may have been a liquidity grab. If Gold breaks above the high, holds above it, and uses the level as support, that is a different message.
The break itself is not enough. The behavior after the break matters.
--------------------------------------------------
5. Daily Chart: The Working Bias
The Daily chart is where the plan becomes practical.
For many Gold traders, Daily is the most important higher timeframe because it gives the working bias. If Daily is trending higher, pulling back into demand, and still holding the last meaningful swing low, the trader naturally becomes more interested in long setups.
If Daily is pressing into supply after an extended rally and starts leaving upper wicks, the trader becomes careful with longs and starts watching for rejection.
Daily also tells when there is no clean bias. Sometimes Gold is simply in the middle of a Daily range. It is not at support. It is not at resistance. It is not breaking out. It is not giving a clean pullback.
That is usually not where professionals want to risk money.
On Daily, a professional asks:
One of the most useful Daily habits is marking the previous day high and previous day low. On XAUUSD, those levels often act like magnets. Price may run yesterday's high during London or New York and then reverse. Or it may break yesterday's high and hold, showing real bullish acceptance.
Again, the level is not the trade. The reaction is the trade.
--------------------------------------------------
6. H4 Chart: Where the Setup Starts to Show
H4 is where the higher-timeframe idea starts becoming a tradable setup.
Suppose Daily is bullish and price is pulling back into demand. That sounds interesting, but it is not enough. On H4, a professional studies how the pullback is happening.
Is Gold falling in strong bearish candles, breaking every swing low with momentum?
Or is Gold drifting lower in overlapping candles, with wicks and weak bodies?
That difference matters.
An impulsive move against your idea tells you to wait. A corrective move into your level tells you to prepare.
H4 is excellent for reading the quality of movement:
Many professionals use H4 to mark supply and demand zones. The best zones are usually the ones that started strong movement. A small base before a sharp rally can become demand. A small base before a sharp drop can become supply.
But a zone is still only a place to watch. Gold can slice through H4 supply if the higher-timeframe trend is strong. It can pierce H4 demand during news and reclaim it later.
The trader's job is not to worship zones. The trader's job is to observe how price behaves there.
--------------------------------------------------
7. H1 Chart: The Intraday Story
H1 is where a lot of professional intraday Gold work happens.
It is slow enough to filter some M5 noise, but fast enough to show the trading day developing. If a trader used only one intraday confirmation timeframe for XAUUSD, H1 would be one of the best choices.
On H1, a professional watches:
H1 candle closes matter on Gold.
A quick spike below support on M5 can scare traders, but if the H1 candle closes back above support with a strong lower wick, the story changes. That may show rejection. If H1 closes below support with a strong body, the story is different. That may show acceptance.
This is why professionals wait for candle closes more often than beginners do. An open candle can lie, especially on Gold.
--------------------------------------------------
8. M15 Chart: Entry Planning
M15 is where the idea becomes a possible trade.
By the time a professional drops to M15, the main work should already be done. The trader already knows the higher-timeframe bias, important levels, and whether they are interested in longs, shorts, or no trade.
M15 is used to refine the entry, not invent the whole story.
If Gold is testing H4 demand and H1 has swept a low and reclaimed it, M15 can be used to look for a higher low, a bullish displacement candle, or a break of local structure.
If Gold is rejecting H4 supply, M15 can be used to watch for a lower high and a break of local support.
A professional is not buying because one green candle appears. They are buying only if the green candle fits the higher-timeframe story and gives a clean place for invalidation.
If Gold has already moved too far from the level, the stop may be too wide and the target too close. A professional can like the direction and still skip the trade.
That is maturity.
--------------------------------------------------
9. M5 Chart: Timing Only
M5 is useful, but dangerous.
It is for timing, not for building the main bias.
On M5, Gold creates constant drama. A small liquidity sweep looks like a reversal. A sudden candle looks like a breakout. A pullback feels like a trend change. If you stare at M5 without higher-timeframe context, you will start reacting to every movement.
A professional uses M5 only after the larger story is clear.
Example:
That is proper use of M5.
Improper use is opening M5 first, seeing a green candle, buying, and then looking at Daily afterward to justify the trade.
--------------------------------------------------
10. Market Structure Comes Before Candle Patterns
If a trader does not understand market structure, candlestick patterns will confuse them.
Market structure is the rhythm of price:
A bullish candle in an uptrend pullback is very different from a bullish candle in a downtrend correction. A bearish engulfing candle at resistance means more than the same candle in the middle of nowhere.
Professional traders look for meaningful swings. A swing high is where buyers lost control. A swing low is where sellers lost control.
When Gold returns to these areas, the professional watches closely.
If price breaks a previous swing high and holds above it, structure may be shifting bullish. If price breaks the high but falls back below it, the break may be a liquidity grab. If price breaks a swing low with a strong close, sellers may be taking control. If it only wicks below the low and reclaims it, buyers may have trapped sellers.
The close matters. The follow-through matters. The level matters.
--------------------------------------------------
11. Impulsive Moves vs Corrective Moves
One of the most practical skills in Gold trading is knowing whether price is moving impulsively or correctively.
An impulsive move has force:
A corrective move is slower:
If Daily is bullish and H4 pulls back correctively into demand, a long setup may be forming. If H4 is falling impulsively and breaking support with strong bearish candles, buying too early is dangerous.
Professional traders do not only ask where price is. They ask how price arrived there.
--------------------------------------------------
12. Support and Resistance Are Zones, Not Thin Lines
Gold will teach you not to be too precise.
Support and resistance on XAUUSD should be treated as zones. If you mark 4,700 and price reacts from 4,702 or 4,696, the level may still be working. Gold has spread, volatility, and wick behavior.
A professional support or resistance zone usually comes from:
Once the zone is marked, the professional watches the reaction:
A support zone is not a buy signal. A resistance zone is not a sell signal. They are decision areas.
--------------------------------------------------
13. Breakouts: The Break Is Not the Trade
Gold breakouts are dangerous because they look convincing at exactly the wrong time.
When price breaks a clean high, many traders buy immediately. The candle is green, the level is broken, and the move feels obvious. But Gold often breaks levels to find liquidity.
A professional breakout trader wants acceptance.
Acceptance means:
If Gold breaks above resistance but closes back below it, that is not acceptance. If it wicks above a high and immediately sells off, that may be a failed breakout.
Breakout traders who survive on Gold are patient. They either wait for a confirmed close or wait for the retest. They do not blindly chase the first spike.
--------------------------------------------------
14. Liquidity Grabs Are Normal on Gold
Liquidity grabs are part of XAUUSD behavior.
A liquidity grab happens when price runs above an obvious high or below an obvious low, triggers orders, and then returns.
Common liquidity areas:
Bullish example:
Gold is sitting above Daily demand. Asia forms a range. London breaks below the Asian low. Sellers enter the breakdown. Stops from buyers are triggered. Then price reclaims the Asian low and closes back inside the range.
Now there is a story.
Sell-side liquidity was taken. Price failed to stay below the low. Buyers reclaimed the level. The long idea has context.
Bearish example:
Gold runs above the previous day high into H4 supply. Breakout buyers enter. Price fails to hold above the high, closes back below, and M15 breaks local support.
Now the failed breakout becomes useful information.
--------------------------------------------------
15. Rejection Candles: The Wick Is Only the Beginning
A rejection candle is useful only at the right place.
A long upper wick in the middle of an H1 range does not mean much. A long upper wick after Gold sweeps the previous day high into H4 supply during New York means much more.
When reading rejection candles, professionals ask:
Gold creates many wicks. If you trade every wick, you will overtrade.
The wick must tell a useful story.
--------------------------------------------------
16. Momentum Candles: Strength or Trap?
A big candle on Gold can show real pressure. It can also be the last candle of an exhausted move.
A bullish momentum candle is more trustworthy when it breaks structure, comes out of consolidation, closes near its high, and aligns with higher-timeframe direction.
The same candle is less attractive if it appears after a long rally directly into resistance with no room left to target.
Beginners love entering at the close of a huge candle because the move feels obvious. Professionals often wait for the pullback. They want to know whether the market will defend the level it just broke.
Gold can be moving up, but the long entry may still be poor. Gold can be moving down, but the short entry may still be late.
--------------------------------------------------
17. Session Behavior: Asia, London, New York
Gold does not behave the same all day.
Asian Session
Asia often creates the initial range. Professional traders mark the Asian high and low because London often uses those levels as liquidity.
London Session
London brings stronger participation. It may start the real move, or it may create a trap by sweeping the Asian range and reversing.
New York Session
New York is critical for Gold because U.S. data, Treasury yields, dollar flows, and futures liquidity can move XAUUSD sharply.
Around CPI, NFP, FOMC, PPI, retail sales, and major Fed headlines, technical levels can still matter, but execution becomes more dangerous. Spreads can widen. Candles can spike both ways. Stops can slip.
Professional traders either have a tested news plan or they step aside.
Avoiding a bad environment is not weakness. It is part of the job.
--------------------------------------------------
18. Professional Pre-Trade Routine
--------------------------------------------------
19. Professional Trade Logic Card
Pine Script®
--------------------------------------------------
20. Confirmation: What Professionals Wait For
For a bullish idea on Gold, confirmation may look like this:
For a bearish idea:
Confirmation must fit the original idea. A random green candle is not bullish confirmation. A random red candle is not bearish confirmation.
Confirmation should reduce uncertainty, not simply make the trader feel better.
--------------------------------------------------
21. Invalidation and Stop Loss Logic
Before entering, a professional knows where the idea is wrong.
If buying after a liquidity sweep below support, the idea is usually wrong if price breaks and accepts below the sweep low.
If shorting after a failed breakout above resistance, the idea is usually wrong if price reclaims and holds above the sweep high.
Beginners often place stops based on money. Professionals place stops based on structure, then adjust position size.
Good stop placement on Gold may be:
Bad stop placement:
--------------------------------------------------
22. A Realistic Bullish Scenario
Gold is bullish on Daily and pulls back into a Daily demand area. The H4 pullback is not aggressive. Candles overlap. Sellers are pushing lower, but not with real authority.
Asia forms a tight range. London opens and breaks below the Asian low. Beginners short the breakdown. Early buyers are stopped out.
Then price taps into H4 demand and starts to reject.
The professional does not buy immediately. They wait for H1.
If H1 closes back above the Asian low, the breakdown has failed. Then the trader moves to M15. If M15 forms a higher low above the reclaimed level and breaks a small internal high, the long setup becomes valid.
The stop goes below the sweep low. The first target may be H1 resistance, previous day high, or nearby supply.
The professional did not buy the first touch. They did not short the breakdown. They waited for the trap to show itself.
--------------------------------------------------
23. A Realistic Bearish Scenario
Gold rallies for several sessions and approaches Weekly resistance. Daily candles are still bullish, but bodies are getting smaller and upper wicks are appearing.
During New York, price spikes above the previous day high and into H4 supply. Breakout buyers enter. Stops from sellers are triggered. For a few minutes, the move looks strong.
Then the candle fails to hold. H1 closes back below the previous day high with a long upper wick. M15 breaks local support. A pullback follows, but it cannot reclaim the broken level.
Now the professional considers a short.
The idea is not "red candle, sell."
The idea is:
That is a professional short idea.
--------------------------------------------------
24. When No Trade Is the Best Trade
Sometimes Gold gives nothing clean.
Daily is in the middle of a range. H4 has no clean structure. H1 candles are wicking both ways. M15 gives a buy signal, then a sell signal, then another buy signal.
The market feels active but directionless.
This is where professionals do something beginners find difficult:
No trade is not laziness. It is a decision.
If the chart does not offer a meaningful level, clean confirmation, and logical invalidation, the trade is not ready.
Gold can make traders feel foolish for waiting because it may still move. But a move without your setup is not your money.
The goal is not to catch every candle. The goal is to take trades that fit a repeatable process.
--------------------------------------------------
25. Trade Quality Test Before Entry
Before entering any XAUUSD trade, ask:
If the answers are weak, the professional passes.
A clean trade idea should be explainable in one or two sentences.
Example:
That is a clean idea.
This is not:
--------------------------------------------------
26. What Beginners Misuse Most
Most beginner mistakes come from wanting certainty too quickly.
Gold does not give certainty. It gives clues.
The professional waits until enough clues line up to justify risk.
--------------------------------------------------
Final Words
If you want to read XAUUSD like a professional, stop asking what the next candle will be.
Start asking what the chart is trying to prove.
This is how serious Gold traders think.
They do not need every candle. They do not need every move. They need a clear story, a defined risk point, and enough patience to wait for the market to come to them.
That is the professional way to analyze Gold before entering a trade.
--------------------------------------------------
Next post, I will apply this full blueprint practically on the current XAUUSD chart using Monthly, Weekly, Daily, H4, H1, M15, and M5 analysis. Wait for NEXT update.
How Professional Gold Traders Actually Read a Chart Before Entering a Trade
This blueprint is written specifically for serious XAUUSD traders who want to understand how professional traders actually read candlestick charts before committing money to a trade.
This is not a signal post. It is not financial advice. It is a practical guide for understanding context, location, confirmation, and risk in the Gold market.
The goal is not to predict every candle. The goal is to understand what the chart is trying to prove before you risk capital.
--------------------------------------------------
Professional Timeframe Workflow
- Monthly -> Macro direction and big market weather
- Weekly -> Institutional structure and major swing levels
- Daily -> Trading bias and important support/resistance
- H4 -> Setup formation and quality of the move
- H1 -> Intraday confirmation and session story
- M15 -> Entry planning and local structure
- M5 -> Precise execution timing only
--------------------------------------------------
1. Gold Is Not Just Another Forex Pair
Before reading candlesticks on XAUUSD, a trader must understand the instrument itself.
Gold is quoted against the U.S. dollar, but it does not behave like a normal currency pair. EURUSD can grind slowly for hours. Gold can stay quiet for half a session and then move aggressively in a few minutes. GBPUSD can be volatile, but XAUUSD has a different kind of violence. It often runs obvious highs and lows, rejects levels with deep wicks, and reacts sharply to U.S. yields, the dollar, inflation data, central-bank expectations, and risk sentiment.
That is why a setup copied from a normal Forex pair often fails on Gold. A stop loss that looks reasonable on EURUSD may be too tight on XAUUSD. A candle that looks huge on another pair may be normal breathing room on Gold.
Gold respects levels, but not politely. It may break above resistance, pull in breakout buyers, trigger stops from early sellers, and then collapse back below the level. It may break below support, scare buyers out, invite fresh shorts, and then reclaim the same level aggressively.
On Gold, the first break is often not the truth. The reaction after the break tells the real story.
Professional Gold traders therefore ask one main question around every important level:
- Is price accepting beyond the level?
- Or is price only raiding liquidity and coming back?
Acceptance means price breaks a level and holds beyond it. A raid means price only breaks the level long enough to trigger orders, then returns back inside the previous structure.
That difference is everything.
--------------------------------------------------
2. A Professional Does Not Start on M5
Most struggling traders open the M5 chart first. They see Gold moving, draw a quick line near current price, and start hunting for an entry. The chart feels alive, so they feel they must act.
A professional usually does the opposite.
They zoom out first.
The reason is simple: a lower-timeframe candle does not carry enough meaning by itself. A bullish M5 candle at a Daily demand zone may matter. A bullish M5 candle directly into Weekly supply may be a trap. A bearish M15 candle after a liquidity sweep may be powerful. The same candle in the middle of an H1 range may be useless.
The candle does not create the meaning. The location creates the meaning.
This is why top-down analysis matters.
- Monthly tells the big market condition.
- Weekly shows the institutional swing.
- Daily gives the working bias.
- H4 shows whether a setup is forming.
- H1 confirms the intraday story.
- M15 prepares the entry.
- M5 fine-tunes the execution.
When beginners lose money on Gold, it is often because they allow the entry timeframe to become the decision timeframe. M5 becomes the boss. One green candle means buy. One red candle means sell. That is not analysis. That is reaction.
--------------------------------------------------
3. Monthly Chart: The Big Weather
The Monthly chart is not where an intraday trader enters, but it tells the market weather.
If Gold is pushing into a historical high after several strong monthly candles, you must know that. The market may still go higher, but buying late into a stretched monthly area is very different from buying a pullback in the middle of a healthy trend.
If Gold has rejected the same monthly zone several times, that matters too. A lower-timeframe long setup may still work, but the trader should be more careful with targets.
On Monthly, a professional checks:
- Is Gold in a long-term uptrend or broad range?
- Is price extended after a large move?
- Are monthly candles closing strongly or leaving rejection wicks?
- Is price near historical highs, lows, or a major breakout level?
- Has Gold broken out of a multi-month range, or is it still rotating inside one?
The Monthly chart is not used for entry. It is used to avoid danger. If price is pressing into a huge monthly resistance area, a professional does not blindly buy every M15 breakout. If price is holding above a major monthly support, a professional does not aggressively short every small red candle.
Monthly tells whether the market is fresh, stretched, or near an area where bigger players may care.
--------------------------------------------------
4. Weekly Chart: Where Bigger Money Leaves Footprints
The Weekly chart is where professional Gold traders begin to see the larger swing structure.
On Weekly, the focus is not every small candle. The focus is obvious highs and lows that serious traders would notice:
- The high that started a major selloff
- The low that launched a strong rally
- The zone where price rejected for several weeks
- The weekly candle that closed through a major level with force
- Previous weekly high and previous weekly low
Gold often reacts around previous weekly highs and lows because liquidity sits there. Traders place stops around those levels. Breakout traders place orders there. Sellers defend highs. Buyers defend lows.
But the professional does not trade the level blindly. The professional watches the reaction.
If Gold runs above last week's high and immediately closes back below it, the breakout may have been a liquidity grab. If Gold breaks above the high, holds above it, and uses the level as support, that is a different message.
The break itself is not enough. The behavior after the break matters.
Weekly gives the serious trader one important question: which side of the market has the easier job?
--------------------------------------------------
5. Daily Chart: The Working Bias
The Daily chart is where the plan becomes practical.
For many Gold traders, Daily is the most important higher timeframe because it gives the working bias. If Daily is trending higher, pulling back into demand, and still holding the last meaningful swing low, the trader naturally becomes more interested in long setups.
If Daily is pressing into supply after an extended rally and starts leaving upper wicks, the trader becomes careful with longs and starts watching for rejection.
Daily also tells when there is no clean bias. Sometimes Gold is simply in the middle of a Daily range. It is not at support. It is not at resistance. It is not breaking out. It is not giving a clean pullback.
That is usually not where professionals want to risk money.
On Daily, a professional asks:
- Where is the last meaningful Daily swing high?
- Where is the last meaningful Daily swing low?
- Is the current move impulsive or corrective?
- Did yesterday's candle close with strength or rejection?
- Are we trading near the previous day high or low?
- Is price entering supply, demand, or a dead middle area?
One of the most useful Daily habits is marking the previous day high and previous day low. On XAUUSD, those levels often act like magnets. Price may run yesterday's high during London or New York and then reverse. Or it may break yesterday's high and hold, showing real bullish acceptance.
Again, the level is not the trade. The reaction is the trade.
--------------------------------------------------
6. H4 Chart: Where the Setup Starts to Show
H4 is where the higher-timeframe idea starts becoming a tradable setup.
Suppose Daily is bullish and price is pulling back into demand. That sounds interesting, but it is not enough. On H4, a professional studies how the pullback is happening.
Is Gold falling in strong bearish candles, breaking every swing low with momentum?
Or is Gold drifting lower in overlapping candles, with wicks and weak bodies?
That difference matters.
An impulsive move against your idea tells you to wait. A corrective move into your level tells you to prepare.
H4 is excellent for reading the quality of movement:
- Clean higher highs and higher lows show bullish control.
- Clean lower lows and lower highs show bearish control.
- Overlapping candles show correction or indecision.
- Strong displacement from a zone shows real order flow.
- Repeated failure to extend shows exhaustion.
Many professionals use H4 to mark supply and demand zones. The best zones are usually the ones that started strong movement. A small base before a sharp rally can become demand. A small base before a sharp drop can become supply.
But a zone is still only a place to watch. Gold can slice through H4 supply if the higher-timeframe trend is strong. It can pierce H4 demand during news and reclaim it later.
The trader's job is not to worship zones. The trader's job is to observe how price behaves there.
--------------------------------------------------
7. H1 Chart: The Intraday Story
H1 is where a lot of professional intraday Gold work happens.
It is slow enough to filter some M5 noise, but fast enough to show the trading day developing. If a trader used only one intraday confirmation timeframe for XAUUSD, H1 would be one of the best choices.
On H1, a professional watches:
- Did Asia create a range?
- Did London sweep the Asian high or low?
- Did price break a level with a real candle close or only with a wick?
- Did the market hold above a breakout level?
- Did it fall back inside the range?
- Is New York continuing London or reversing it?
H1 candle closes matter on Gold.
A quick spike below support on M5 can scare traders, but if the H1 candle closes back above support with a strong lower wick, the story changes. That may show rejection. If H1 closes below support with a strong body, the story is different. That may show acceptance.
This is why professionals wait for candle closes more often than beginners do. An open candle can lie, especially on Gold.
--------------------------------------------------
8. M15 Chart: Entry Planning
M15 is where the idea becomes a possible trade.
By the time a professional drops to M15, the main work should already be done. The trader already knows the higher-timeframe bias, important levels, and whether they are interested in longs, shorts, or no trade.
M15 is used to refine the entry, not invent the whole story.
If Gold is testing H4 demand and H1 has swept a low and reclaimed it, M15 can be used to look for a higher low, a bullish displacement candle, or a break of local structure.
If Gold is rejecting H4 supply, M15 can be used to watch for a lower high and a break of local support.
A professional is not buying because one green candle appears. They are buying only if the green candle fits the higher-timeframe story and gives a clean place for invalidation.
A setup can be correct but still not tradable if the entry is late.
If Gold has already moved too far from the level, the stop may be too wide and the target too close. A professional can like the direction and still skip the trade.
That is maturity.
--------------------------------------------------
9. M5 Chart: Timing Only
M5 is useful, but dangerous.
It is for timing, not for building the main bias.
On M5, Gold creates constant drama. A small liquidity sweep looks like a reversal. A sudden candle looks like a breakout. A pullback feels like a trend change. If you stare at M5 without higher-timeframe context, you will start reacting to every movement.
A professional uses M5 only after the larger story is clear.
Example:
- Daily is bullish.
- H4 has pulled into demand.
- H1 has swept the low and reclaimed support.
- M15 has formed a higher low.
- M5 now helps time the entry.
That is proper use of M5.
Improper use is opening M5 first, seeing a green candle, buying, and then looking at Daily afterward to justify the trade.
--------------------------------------------------
10. Market Structure Comes Before Candle Patterns
If a trader does not understand market structure, candlestick patterns will confuse them.
Market structure is the rhythm of price:
- Uptrend -> higher highs and higher lows
- Downtrend -> lower lows and lower highs
- Range -> similar highs and lows holding repeatedly
- Transition -> the rhythm starts changing
A bullish candle in an uptrend pullback is very different from a bullish candle in a downtrend correction. A bearish engulfing candle at resistance means more than the same candle in the middle of nowhere.
Professional traders look for meaningful swings. A swing high is where buyers lost control. A swing low is where sellers lost control.
When Gold returns to these areas, the professional watches closely.
If price breaks a previous swing high and holds above it, structure may be shifting bullish. If price breaks the high but falls back below it, the break may be a liquidity grab. If price breaks a swing low with a strong close, sellers may be taking control. If it only wicks below the low and reclaims it, buyers may have trapped sellers.
The close matters. The follow-through matters. The level matters.
--------------------------------------------------
11. Impulsive Moves vs Corrective Moves
One of the most practical skills in Gold trading is knowing whether price is moving impulsively or correctively.
An impulsive move has force:
- Large candle bodies
- Strong closes
- Little overlap
- Fast displacement
- Breaks of structure
A corrective move is slower:
- Smaller candles
- More overlap
- Wicks on both sides
- Less confidence
- Drifting movement instead of direct pressure
If Daily is bullish and H4 pulls back correctively into demand, a long setup may be forming. If H4 is falling impulsively and breaking support with strong bearish candles, buying too early is dangerous.
Professional traders do not only ask where price is. They ask how price arrived there.
--------------------------------------------------
12. Support and Resistance Are Zones, Not Thin Lines
Gold will teach you not to be too precise.
Support and resistance on XAUUSD should be treated as zones. If you mark 4,700 and price reacts from 4,702 or 4,696, the level may still be working. Gold has spread, volatility, and wick behavior.
A professional support or resistance zone usually comes from:
- Multiple reactions
- A strong rejection
- A previous breakout and retest
- A consolidation boundary
- A major swing high or low
- A psychological number
Once the zone is marked, the professional watches the reaction:
- Does price reject sharply?
- Does it consolidate at the level?
- Does it break and hold?
- Does it sweep beyond the level and return?
- Does it approach with strength or exhaustion?
A support zone is not a buy signal. A resistance zone is not a sell signal. They are decision areas.
--------------------------------------------------
13. Breakouts: The Break Is Not the Trade
Gold breakouts are dangerous because they look convincing at exactly the wrong time.
When price breaks a clean high, many traders buy immediately. The candle is green, the level is broken, and the move feels obvious. But Gold often breaks levels to find liquidity.
A professional breakout trader wants acceptance.
Acceptance means:
- Price closes beyond the level
- The body is strong, not only a wick
- The retest holds
- Price does not fall back inside the old range
- Follow-through appears after the breakout
If Gold breaks above resistance but closes back below it, that is not acceptance. If it wicks above a high and immediately sells off, that may be a failed breakout.
Breakout traders who survive on Gold are patient. They either wait for a confirmed close or wait for the retest. They do not blindly chase the first spike.
--------------------------------------------------
14. Liquidity Grabs Are Normal on Gold
Liquidity grabs are part of XAUUSD behavior.
A liquidity grab happens when price runs above an obvious high or below an obvious low, triggers orders, and then returns.
Common liquidity areas:
- Previous day high
- Previous day low
- Asian high
- Asian low
- Equal highs
- Equal lows
- Weekly high
- Weekly low
- Round numbers
Bullish example:
Gold is sitting above Daily demand. Asia forms a range. London breaks below the Asian low. Sellers enter the breakdown. Stops from buyers are triggered. Then price reclaims the Asian low and closes back inside the range.
Now there is a story.
Sell-side liquidity was taken. Price failed to stay below the low. Buyers reclaimed the level. The long idea has context.
Bearish example:
Gold runs above the previous day high into H4 supply. Breakout buyers enter. Price fails to hold above the high, closes back below, and M15 breaks local support.
Now the failed breakout becomes useful information.
A sweep without reclaim is not enough. The reclaim is what turns a stop run into a trade idea.
--------------------------------------------------
15. Rejection Candles: The Wick Is Only the Beginning
A rejection candle is useful only at the right place.
A long upper wick in the middle of an H1 range does not mean much. A long upper wick after Gold sweeps the previous day high into H4 supply during New York means much more.
When reading rejection candles, professionals ask:
- What did the candle reject?
- Did it reject a higher-timeframe level?
- Did it sweep liquidity first?
- Where did it close?
- Did the next candle confirm it?
- Did lower-timeframe structure shift afterward?
Gold creates many wicks. If you trade every wick, you will overtrade.
The wick must tell a useful story.
--------------------------------------------------
16. Momentum Candles: Strength or Trap?
A big candle on Gold can show real pressure. It can also be the last candle of an exhausted move.
A bullish momentum candle is more trustworthy when it breaks structure, comes out of consolidation, closes near its high, and aligns with higher-timeframe direction.
The same candle is less attractive if it appears after a long rally directly into resistance with no room left to target.
Beginners love entering at the close of a huge candle because the move feels obvious. Professionals often wait for the pullback. They want to know whether the market will defend the level it just broke.
Direction and trade quality are not the same thing.
Gold can be moving up, but the long entry may still be poor. Gold can be moving down, but the short entry may still be late.
--------------------------------------------------
17. Session Behavior: Asia, London, New York
Gold does not behave the same all day.
Asian Session
Asia often creates the initial range. Professional traders mark the Asian high and low because London often uses those levels as liquidity.
London Session
London brings stronger participation. It may start the real move, or it may create a trap by sweeping the Asian range and reversing.
New York Session
New York is critical for Gold because U.S. data, Treasury yields, dollar flows, and futures liquidity can move XAUUSD sharply.
Around CPI, NFP, FOMC, PPI, retail sales, and major Fed headlines, technical levels can still matter, but execution becomes more dangerous. Spreads can widen. Candles can spike both ways. Stops can slip.
Professional traders either have a tested news plan or they step aside.
Avoiding a bad environment is not weakness. It is part of the job.
--------------------------------------------------
18. Professional Pre-Trade Routine
- Check the calendar
Before reading candles, check if CPI, NFP, FOMC, PPI, retail sales, or major Fed news is coming. - Read Monthly and Weekly
Understand the big direction, major highs/lows, and institutional zones. - Study Daily carefully
Mark the working bias, previous day high/low, Daily supply, Daily demand, and important swing levels. - Use H4 for setup formation
Check whether price is moving impulsively or correctively into your zone. - Use H1 for confirmation
Watch candle closes, session behavior, breakouts, sweeps, and acceptance. - Use M15 for entry planning
Look for higher lows, lower highs, structure breaks, reclaims, and retests. - Use M5 only for execution
Fine-tune the entry after the larger story is already clear.
--------------------------------------------------
19. Professional Trade Logic Card
--------------------------------------------------
20. Confirmation: What Professionals Wait For
For a bullish idea on Gold, confirmation may look like this:
- Price sweeps a low into demand
- H1 closes back above broken support
- M15 forms a higher low
- Price breaks a minor structure high
- The retest holds above the reclaim level
For a bearish idea:
- Price sweeps a high into supply
- H1 closes back below resistance
- M15 forms a lower high
- Price breaks local support
- The retest fails from below
Confirmation must fit the original idea. A random green candle is not bullish confirmation. A random red candle is not bearish confirmation.
Confirmation should reduce uncertainty, not simply make the trader feel better.
--------------------------------------------------
21. Invalidation and Stop Loss Logic
Before entering, a professional knows where the idea is wrong.
If buying after a liquidity sweep below support, the idea is usually wrong if price breaks and accepts below the sweep low.
If shorting after a failed breakout above resistance, the idea is usually wrong if price reclaims and holds above the sweep high.
Beginners often place stops based on money. Professionals place stops based on structure, then adjust position size.
Good stop placement on Gold may be:
- Below the sweep low for a long setup
- Below the M15 higher low after reclaim
- Below the demand zone being defended
- Above the sweep high for a short setup
- Above the M15 lower high after rejection
- Above the supply zone being defended
Bad stop placement:
- Exactly at a round number
- Inside the rejection wick
- Too close because lot size is too large
- At a random fixed distance
- Moved farther after entry because the trader cannot accept being wrong
Professionals reduce position size to fit the correct stop. Beginners shrink the stop to fit the position size.
--------------------------------------------------
22. A Realistic Bullish Scenario
Gold is bullish on Daily and pulls back into a Daily demand area. The H4 pullback is not aggressive. Candles overlap. Sellers are pushing lower, but not with real authority.
Asia forms a tight range. London opens and breaks below the Asian low. Beginners short the breakdown. Early buyers are stopped out.
Then price taps into H4 demand and starts to reject.
The professional does not buy immediately. They wait for H1.
If H1 closes back above the Asian low, the breakdown has failed. Then the trader moves to M15. If M15 forms a higher low above the reclaimed level and breaks a small internal high, the long setup becomes valid.
The stop goes below the sweep low. The first target may be H1 resistance, previous day high, or nearby supply.
The professional did not buy the first touch. They did not short the breakdown. They waited for the trap to show itself.
--------------------------------------------------
23. A Realistic Bearish Scenario
Gold rallies for several sessions and approaches Weekly resistance. Daily candles are still bullish, but bodies are getting smaller and upper wicks are appearing.
During New York, price spikes above the previous day high and into H4 supply. Breakout buyers enter. Stops from sellers are triggered. For a few minutes, the move looks strong.
Then the candle fails to hold. H1 closes back below the previous day high with a long upper wick. M15 breaks local support. A pullback follows, but it cannot reclaim the broken level.
Now the professional considers a short.
The idea is not "red candle, sell."
The idea is:
- Buy-side liquidity was swept
- Price entered higher-timeframe supply
- Breakout buyers failed
- Lower-timeframe structure broke down
- Invalidation is clear above the sweep high
That is a professional short idea.
--------------------------------------------------
24. When No Trade Is the Best Trade
Sometimes Gold gives nothing clean.
Daily is in the middle of a range. H4 has no clean structure. H1 candles are wicking both ways. M15 gives a buy signal, then a sell signal, then another buy signal.
The market feels active but directionless.
This is where professionals do something beginners find difficult:
They do nothing.
No trade is not laziness. It is a decision.
If the chart does not offer a meaningful level, clean confirmation, and logical invalidation, the trade is not ready.
Gold can make traders feel foolish for waiting because it may still move. But a move without your setup is not your money.
The goal is not to catch every candle. The goal is to take trades that fit a repeatable process.
--------------------------------------------------
25. Trade Quality Test Before Entry
Before entering any XAUUSD trade, ask:
- Is the higher-timeframe bias clear?
- Is price at a meaningful level?
- Did liquidity get taken?
- Did the candle close confirm the idea?
- Is there a clean invalidation point?
- Is the stop in a logical place?
- Is the first target far enough away?
- Is the session suitable?
- Is there high-impact news nearby?
- Am I calm, or am I chasing?
If the answers are weak, the professional passes.
A clean trade idea should be explainable in one or two sentences.
Example:
Gold swept the Asian low into H4 demand, H1 reclaimed the low, M15 formed a higher low, and my stop is below the sweep.
That is a clean idea.
This is not:
Gold is going up because the candle is green and I do not want to miss it.
--------------------------------------------------
26. What Beginners Misuse Most
- They misuse timeframes
They take direction from M5 and look for permission from Daily afterward. - They misuse candle patterns
They trade engulfing candles, pin bars, and dojis without asking where those candles formed. - They misuse support and resistance
They draw too many lines and then trade every touch. - They misuse breakouts
They buy the first break and sell the first breakdown without waiting for acceptance. - They misuse stop losses
They place stops where the money loss feels acceptable instead of where the chart idea is invalid. - They misuse patience
They think waiting means missing out. In reality, waiting is how professionals avoid becoming liquidity.
Most beginner mistakes come from wanting certainty too quickly.
Gold does not give certainty. It gives clues.
The professional waits until enough clues line up to justify risk.
--------------------------------------------------
Final Words
If you want to read XAUUSD like a professional, stop asking what the next candle will be.
Start asking what the chart is trying to prove.
- Is price accepting above resistance or only sweeping liquidity?
- Is the move into support corrective or impulsive?
- Is the rejection happening at a meaningful level?
- Is the lower timeframe confirming the higher-timeframe idea?
- Is there a clean place to be wrong?
- Is the trade still worth taking after spread, stop size, and nearby targets are considered?
This is how serious Gold traders think.
They do not need every candle. They do not need every move. They need a clear story, a defined risk point, and enough patience to wait for the market to come to them.
The candle shape matters. Location matters more. Context matters more. Confirmation matters more. Risk matters most.
That is the professional way to analyze Gold before entering a trade.
--------------------------------------------------
Next post, I will apply this full blueprint practically on the current XAUUSD chart using Monthly, Weekly, Daily, H4, H1, M15, and M5 analysis. Wait for NEXT update.
Note
I am currently working on practical multi-timeframe analysis so you can understand everything step-by-step in real market conditions. Stay connected with this series to learn my trading style, professional chart analysis process, and how I use TradingView tools for XAUUSD analysis.
Note
XAUUSD Monthly Chart: The Big WeatherAnalysis time: 2026-05-11 06:38 UTC
Current spot reference: 4,671.36
This is a higher-timeframe weather report, not an entry signal.
The Monthly chart helps a trader understand danger, extension, major supply, major support, and whether Gold is trending cleanly or rotating inside a large range.
--------------------------------------------------
1. Is Gold in a long-term uptrend or broad range?
Gold is still structurally elevated compared with the previous year, so the long-term bullish history is not erased.
But the current Monthly structure is not a clean fresh one-way trend anymore. After the major high around 5,602, price has been rotating inside a wide range instead of continuing in a clean vertical impulse.
Professional answer: Long-term bullish history is still there, but current Monthly behavior is range rotation.
--------------------------------------------------
2. Is price extended after a large move?
Yes. Price is still extended compared with lower historical levels, but it is not sitting at the very top right now.
Current spot around 4,671.36 is below the upper supply zone and above the major support zone. That means Gold is not cheap, but it is also not sitting directly at the extreme high.
Professional answer: Not cheap, not at the top; avoid emotional late buying.
--------------------------------------------------
3. Are monthly candles closing strongly or leaving rejection wicks?
The chart shows a strong rejection from the upper zone after the large advance.
Current price is not closing above the major high area. That tells me buyers are still present, but they have not proven fresh Monthly breakout control yet.
This matters because lower-timeframe long setups can still work, but targets should be realistic when price is trading below higher-timeframe supply.
Professional answer: The top-side rejection matters; lower-timeframe longs need realistic targets.
--------------------------------------------------
4. Is price near historical highs, lows, or a major breakout level?
Current price is not near the extreme high, and it is not near the deepest low.
It is trading between the upper Monthly supply area and the major support around 4,500. This makes the current area a middle-to-upper range location, not a clean extreme.
A professional trader does not treat this area as an automatic breakout, and also does not treat it as an automatic reversal.
Professional answer: Do not treat the current area as an automatic breakout or automatic reversal.
--------------------------------------------------
5. Has Gold broken out of a multi-month range, or is it rotating inside one?
There is no clean confirmed Monthly breakout right now.
Gold is still rotating inside a large higher-timeframe range between upper supply and lower support. Until price closes decisively beyond that range, the Monthly chart should be treated as a danger map, not as a direct entry signal.
Professional answer: Range rotation until price closes decisively beyond the range.
--------------------------------------------------
Final Monthly Read
The Monthly chart is warning traders not to be careless.
Gold has a strong long-term bullish background, but current price is not in a fresh Monthly breakout. The market is sitting below upper supply and above major support, so a professional trader uses this timeframe as a danger map.
If a trader is looking for intraday longs, targets should be realistic near higher-timeframe resistance.
If a trader is looking for shorts, they should remember that the broader market has not broken major support yet.
Clean Monthly conclusion:
Gold is strong historically, but currently rotating. Wait for lower-timeframe confirmation instead of blindly buying or selling from the Monthly chart.
Note
XAUUSD Weekly Chart: Where Bigger Money Leaves Footprints
Current spot reference: 4,671.36
Weekly chart is not an entry signal.
It is the timeframe where a serious Gold trader studies the bigger swing structure, obvious liquidity, weekly rejection areas, and the levels where larger traders are likely making decisions.
1. Is Gold in a clean weekly trend or a larger swing range?
Gold still has a strong bullish history behind it, but the current Weekly structure is not a clean one-way trend. After the major high near 5,596.81, price has been rotating below the top and above deeper support.
Professional answer: the background is still strong, but the current Weekly chart is behaving like a wide range. A professional does not treat every intraday push as a fresh breakout until Weekly acceptance appears.
2. Where is the high that started the major selloff?
The major high is around the 5,600 area. That area is important because it is not just a random high. It is the place where buyers failed to hold control and a larger correction started.
Professional answer: this is top-side supply. If Gold moves back toward that region later, lower-timeframe longs should be managed carefully because sellers have already shown interest there.
3. Where is the low that launched a strong rally?
The deeper Weekly swing-low footprint is around 4,098.27. That low launched a strong recovery toward the upper weekly range. More recently, the 4,500-4,510 area was defended and produced another recovery attempt.
Professional answer: 4,098 is the bigger swing-low footprint; 4,500-4,510 is the recent defended weekly support.
4. Where has price rejected for several weeks?
The important Weekly rejection/supply band is roughly 4,749-4,889. This is where Gold has repeatedly met selling pressure after recovery moves.
Professional answer: this zone should not be treated as an automatic sell, but it is definitely a decision area. If price sweeps into it and fails, shorts may get cleaner confirmation. If price closes above it and holds, the market message changes.
5. Which weekly candle closed through a major level with force?
The clearest force candle was the heavy weekly breakdown that pushed through the lower part of the range and closed below the 4,500 area. That candle told professional traders that sellers had real displacement, not just a small pullback.
But the story did not end there. Gold later recovered back above the lower zone, which means the breakdown did not create a clean one-way bearish trend. This is why the current Weekly chart must be treated as a range until one side proves acceptance.
Professional answer: sellers showed force on the breakdown, but buyers later defended the lower area. The market still needs a clean weekly close beyond the range before the bigger bias becomes simple.
6. What are the previous weekly high and low?
Previous weekly high: 4,764.60
Previous weekly low: 4,500.66
Current price is trading inside that previous weekly range. That means the market has not yet proven a clean breakout above last week's high or a clean breakdown below last week's low.
Professional answer: the previous weekly high is buy-side liquidity. The previous weekly low is sell-side liquidity. The reaction after either side is taken matters more than the break itself.
7. Has Gold broken out, or is it still rotating?
Right now the Weekly chart is still rotating inside a larger range. A clean Weekly breakout would need price to close and hold above the upper rejection band. A bearish shift would need price to lose the 4,500 support area with acceptance.
Professional answer: no clean weekly breakout yet. The market is still between major levels.
8. Which side of the market has the easier job?
At the current location, neither side has a completely easy job.
Buyers have defended the lower area, but they still need to prove strength above 4,765 and then above the 4,749-4,889 weekly supply band.
Sellers have defended the upper area, but they still need to break and hold below 4,500 before the Weekly chart becomes clearly heavy.
Professional answer: buyers have the historical background, sellers have the nearby resistance. The cleaner opportunity is not in the middle. The cleaner opportunity comes after a reaction at last week's high, last week's low, weekly supply, or weekly support.
Final Weekly Read
The Weekly chart is telling traders to respect both sides. Gold is not weak enough to blindly sell every red candle, but it is not clean enough to blindly buy every lower-timeframe breakout either.
The professional read is simple:
- Above 4,765, watch whether price accepts or only grabs liquidity.
- Inside the range, avoid emotional entries from the middle.
- Near 4,500-4,510, watch for support defense or support failure.
- Near 4,749-4,889, watch for rejection or real breakout acceptance.
Weekly conclusion: Gold is still structurally strong in the bigger picture, but the active Weekly chart is range-driven. A professional trader waits for price to prove acceptance at the edge before committing serious risk.
Note

Note
XAUUSD H4 Chart: Where the Setup Starts to Show
Current spot reference: 4,671.36
H4 is where the higher-timeframe idea starts becoming a tradable setup.
Daily gives the working bias, but H4 shows whether price is moving into that bias with strength, correction, exhaustion, or real displacement.
1. Is a tradable setup forming on H4?
Yes, a setup is forming, but it is not fully confirmed yet.
The Daily chart is still inside a wider range, and H4 is now showing price reacting after the pullback from the recent high. That reaction matters, but a reaction alone is not an entry. A professional wants to see whether price can reclaim the reaction area or whether sellers accept below it.
Professional answer: H4 is showing setup formation, not execution confirmation.
2. Is Gold falling with strong bearish momentum or drifting lower correctively?
After the high near 4,764.60, Gold did not collapse in one clean bearish leg. The move became more overlapping. Candles started pushing down, pausing, rejecting, and failing to extend smoothly.
That kind of movement is usually more corrective than impulsive. It tells a professional to prepare, but not to jump blindly.
Professional answer: the current H4 pullback is mostly corrective and overlapping, not a clean bearish displacement yet.
3. What is the current H4 market structure?
The bullish side showed real control when price displaced from the 4,500 area and pushed toward 4,764. That was the strongest recent H4 message from buyers.
After that, sellers started creating lower highs near the upper zone. So the structure is mixed: buyers created the large recovery leg, but sellers are now defending the top side.
Professional answer: H4 structure is not clean one-way bullish anymore. It is a recovery leg followed by corrective pullback and lower-high pressure.
4. Where is the H4 supply zone?
The practical H4 supply zone is around 4,725-4,765.
This is where price repeatedly failed to extend higher. It includes the recent H4 swing high and the area where sellers began pushing back against the recovery.
Professional answer: 4,725-4,765 is the H4 supply/failure zone. Longs into that area need caution unless price accepts above it.
5. Where is the H4 demand zone?
The cleaner H4 demand zone is around 4,545-4,595. This is the base area before Gold pushed sharply higher toward the recent swing high.
There is also deeper demand around 4,500-4,535, which is the major swing-low defense area. If price returns there, the reaction becomes important again.
Professional answer: 4,545-4,595 is the first H4 demand zone; 4,500-4,535 is the deeper defensive demand area.
6. Is there strong displacement from a zone?
Yes. The move from the 4,500 region toward 4,764 was clear bullish displacement. That rally showed real order flow from the lower zone.
But after price reached supply, the market stopped extending cleanly. That is why professionals separate the impulse from the current pullback.
Professional answer: bullish displacement came from the lower demand area, but current price is now in a reaction phase after meeting H4 supply.
7. Is there repeated failure to extend or exhaustion?
Yes. Near the upper H4 zone, Gold failed to continue cleanly above 4,765. Later attempts toward the upper area did not create a fresh breakout. That is a sign of exhaustion or at least hesitation.
This does not mean the market must sell off. It simply means buyers have not proven fresh control above supply.
Professional answer: repeated failure near the upper zone warns that longs need confirmation instead of chasing.
8. What should a professional do with this H4 chart?
A professional does not worship the zones. The job is to watch behavior around them.
If price reclaims the current reaction area and H1/M15 starts forming higher lows, the H4 chart can support a long continuation idea.
If price accepts below the current reaction low around 4,648, the pullback can continue toward H4 demand.
Professional answer: use H4 to locate the setup, then wait for H1/M15 confirmation before entry.
Final H4 Read
The H4 chart says Gold is between two important stories:
- Buyers created strong displacement from the 4,500 area.
- Sellers defended the 4,725-4,765 supply area.
- The current pullback is overlapping and corrective so far.
- The reaction around 4,648-4,685 needs confirmation.
H4 conclusion: The setup is starting to show, but the trade is not confirmed. A professional waits to see whether price reclaims the reaction area or accepts below it before dropping to H1, M15, or M5 for entry planning.
Note
XAUUSD Professional Timeframe Workflow - Complete Practical AnalysisAnalysis time: 2026-05-11 06:38 UTC
This is not a signal.
This is a professional chart-reading workflow for XAUUSD. The purpose is to understand context, location, confirmation, and risk before thinking about entry.
Professional Timeframe Workflow
- Monthly -> Macro direction and big market weather
- Weekly -> Institutional structure and major swing levels
- Daily -> Trading bias and important support/resistance
- H4 -> Setup formation and quality of the move
- H1 -> Intraday confirmation and session story
- M15 -> Entry planning and local structure
- M5 -> Precise execution timing only
Monthly Read
Gold remains historically strong, but the current monthly chart is rotating below upper supply and above major support. It is not a clean fresh monthly breakout. Monthly warns traders not to blindly chase lower-timeframe candles into higher-timeframe danger.
Weekly Read
The weekly chart is still range-driven. Major high is near 5,600, major recovery footprint is near 4,098, recent defended support is near 4,500, and the market is still between large weekly decision levels.
Daily Read
The daily working bias is conditional. Last meaningful daily swing high is 4,764.60 and last meaningful daily swing low is 4,500.66. Price is not at clean demand or clean supply; it is closer to the previous day low reaction area.
H4 Read
H4 shows setup formation. Buyers created strong displacement from 4,500, but sellers defended 4,725-4,765. The current pullback is overlapping and corrective, so H4 says prepare, but do not enter blindly.
H1 Read
H1 shows the intraday story. Asia created a range between 4,705.24 and 4,647.82. Previous day low broke with an H1 close, but the Asian low has not accepted cleanly yet. The next completed H1 candle matters more than the open candle.
M15 Read
M15 is planning only. It has swept lower liquidity, but it has not reclaimed the previous day low around 4,678.16. A bullish plan needs reclaim plus higher low. A bearish plan needs acceptance below 4,647.82 or failed retest below 4,678.
M5 Read
M5 is timing only. It shows a sweep below the Asian low and a reaction, but no full execution trigger. Long timing needs micro reclaim and higher low. Short timing needs failed retest or fresh acceptance below the sweep low.
Final Professional Decision
- Current market type: range-driven with intraday sell-side pressure
- Higher-timeframe bias: not clean enough for blind buying or blind selling
- Best professional action: wait for confirmation
- Bullish trigger: H1/M15 reclaim above 4,678-4,681, then higher low
- Bearish trigger: acceptance below 4,647.82 or failed retest below 4,678
- No-trade reason: price is between decision levels and execution trigger is incomplete
Final conclusion:
Gold is not giving a mature trade yet. The professional read is to wait. If price reclaims the previous day low and builds a higher low, the long idea becomes cleaner. If price accepts below the Asian low, the bearish continuation idea becomes cleaner. Until then, the best trade is patience.

Disclaimer
The information and publications are not meant to be, and do not constitute, financial, investment, trading, or other types of advice or recommendations supplied or endorsed by TradingView. Read more in the Terms of Use.
Disclaimer
The information and publications are not meant to be, and do not constitute, financial, investment, trading, or other types of advice or recommendations supplied or endorsed by TradingView. Read more in the Terms of Use.