
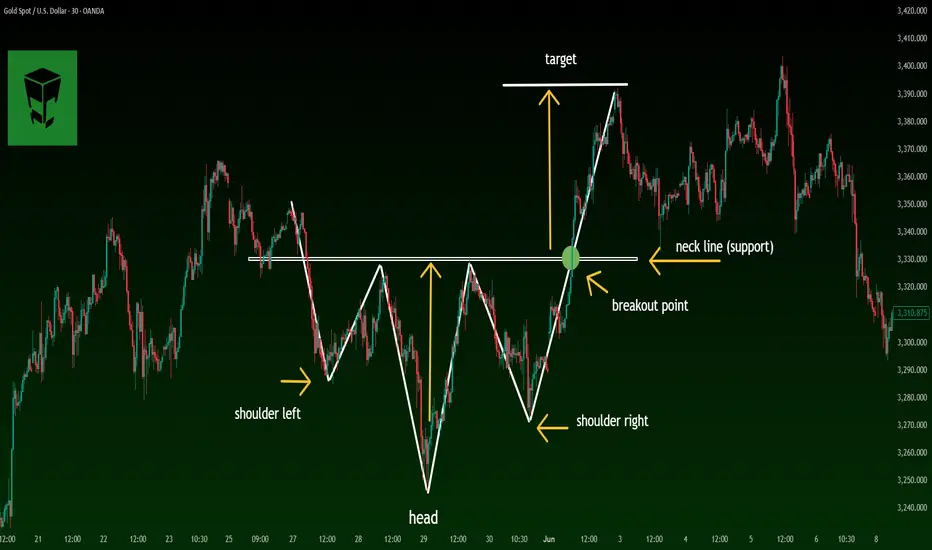
📘 Complete & Professional Guide to the Head and Shoulders Pattern
The Head and Shoulders pattern is one of the most reliable and powerful reversal formations in technical analysis. It typically appears at the end of an uptrend and signals that the bullish momentum is weakening.
🔹 1. What Is the Head and Shoulders Pattern?
The structure consists of three peaks:
🟦 Left Shoulder
The first peak followed by a minor pullback.
🟪 Head
The highest and central peak of the pattern.
🟩 Right Shoulder
The third peak, usually similar in height to the left shoulder but lower than the head.
🔻 Neckline
A support line drawn through the two pullbacks between the shoulders and the head.
A break below this line is the official trade trigger.
🔹 2. What the Pattern Indicates
This formation shows that the bullish trend is losing momentum and a bearish reversal may be approaching.
Left Shoulder → First sign of weakness
Head → Buyers’ final push to make a new high
Right Shoulder → Failure to create a higher high
Neckline Break → Sellers taking control
Pullback → Best entry for professional traders
🔹 3. How to Properly Identify the Pattern (Professional Criteria)
✔️ 1) A Prior Uptrend
Without a preceding trend, the reversal pattern is invalid.
✔️ 2) Three Distinct Peaks
Left Shoulder < Head
Right Shoulder < Head
Shoulders ideally near the same height
✔️ 3) Volume Behavior
Typical volume flow:
Left Shoulder → high volume
Head → moderate volume
Right Shoulder → declining volume
Neckline Break → strong volume (confirmation)
✔️ 4) Neckline Angle
Descending → stronger signal
Ascending → higher chance of false breakouts
Horizontal → neutral strength
✔️ 5) Valid Neckline Break
A strong candle closing beyond the neckline with solid volume is required.
Wicks or weak candles are not considered a true breakout.
✔️ 6) Pullback (Retest)
About 60% of the time, price retests the neckline.
This is the most professional and safest entry.
🔹 4. How to Trade the Pattern
📉 Sell Signal
Formation of the right shoulder
Neckline break
Enter after a candle closes below the neckline
or
Safer entry: enter after the pullback (retest)
🛑 Stop Loss Placement
Above the right shoulder
or
Above the last minor swing high
🎯 Take-Profit Target
Measure the height of the pattern (Distance from Head to Neckline)
Project downward from the breakout point
🔹 5. Inverse Head and Shoulders Pattern
This is the bullish version of the pattern and forms at market bottoms.
Three troughs instead of peaks
Breakout above the neckline triggers a buy
Same target projection applies
This formation often starts strong uptrends.
🔹 6. Pro Tips Used by Professional Traders
⭐️ The right shoulder is more important than the left
⭐️ A taller head indicates a stronger reversal
⭐️ Volume should decrease on the right shoulder
⭐️ Higher timeframes = higher reliability
⭐️ Best entry is after the pullback
🔹 7. Common Mistakes Traders Make
❌ Entering before the neckline is broken
❌ Confusing random peaks with a structured pattern
❌ Ignoring volume behavior
❌ Setting stop-loss levels too tight
❌ Trading the pattern in a sideways market
🔹 8. Final Summary
The Head and Shoulders pattern is one of the most trustworthy reversal signals.
A professional trader should always:
✔️ Confirm the prior trend
✔️ Identify the three-peak structure
✔️ Check volume behavior
✔️ Wait for a valid neckline break
✔️ Prefer pullback entries
✔️ Set proper SL/TP
✔️ Use higher timeframes for accuracy
With consistent practice on TradingView historical charts, you can master this pattern and use it as a profitable tool in your trading strategy.

Disclaimer
The information and publications are not meant to be, and do not constitute, financial, investment, trading, or other types of advice or recommendations supplied or endorsed by TradingView. Read more in the Terms of Use.
Disclaimer
The information and publications are not meant to be, and do not constitute, financial, investment, trading, or other types of advice or recommendations supplied or endorsed by TradingView. Read more in the Terms of Use.