
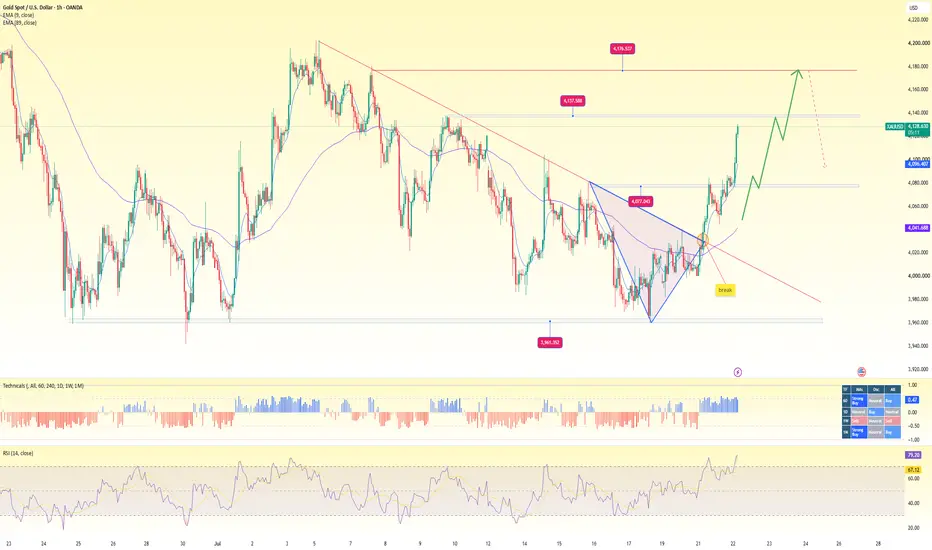
1. Trend Overview
Short-term trend: Strongly Bullish
Key signals:
Price has broken above the descending trendline that had been in place since the beginning of the month.
It has also broken out of a descending triangle / falling wedge pattern (the circled area on the chart).
EMA 9 = 4,096 is positioned above EMA 89 = 4,041, confirming bullish momentum.
RSI (14) = 79, indicating that the market is very strong but has also entered the overbought zone.
👉 Conclusion: Buyers are currently in control of the H1 trend. However, after such a steep rally, the probability of a technical pullback is relatively high before the uptrend continues.
2. Current Outlook
Gold is currently in a strong bullish phase following the breakout of a bearish structure. The higher-probability scenario is a short-term pullback toward 4,080, followed by a continuation move toward 4,176.
The current bullish structure would only be invalidated if an H1 candle closes below 4,020.
3. Resistance Levels
Immediate resistance: 4,137 – 4,140
Major resistance: 4,176 – 4,180
4. Support Levels
Immediate support: 4,077 – 4,080
Dynamic support: EMA 89 around 4,041 – 4,045
Strong demand zone: 4,020 – 4,030
--------------
SELL GOLD zone : 4176 - 4179
SL : 4184
TP : 4160 - 4132 - 4105
----------------
Trade active
Gold prices rose, recovering above 4100, with buying pressure accumulating above 4100.
MOON | Forex Academy hopes to bring the best experience to the Forex community
💠 Update the fastest news
💠 Trend analysis: XAU, BTC, Currency,...
💠My channel:
" t.me/+wmcIWR0hqD5mYjhl "
💠 Update the fastest news
💠 Trend analysis: XAU, BTC, Currency,...
💠My channel:
" t.me/+wmcIWR0hqD5mYjhl "
Related publications
Disclaimer
The information and publications are not meant to be, and do not constitute, financial, investment, trading, or other types of advice or recommendations supplied or endorsed by TradingView. Read more in the Terms of Use.