
📈 1. Trend & Market Structure
Current Trend: Bearish Rejection Within a Short-Term Recovery
Based on the H1 chart:
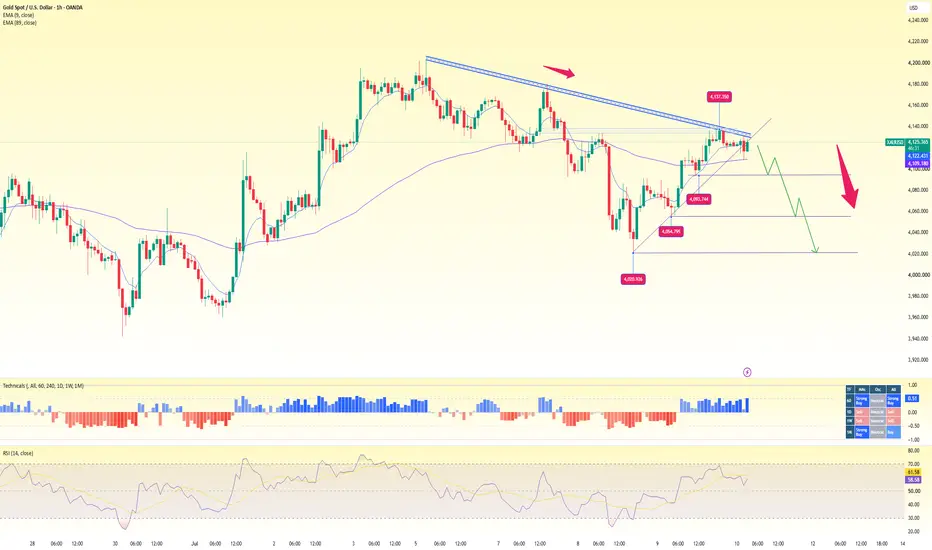
Gold has rebounded from the 4,020–4,055 support zone but is now facing strong resistance at the long-term descending trendline.
Price remains above the EMA89 (~4,109), while the EMA9 (~4,121) has started to flatten, indicating bullish momentum is slowing.
The short-term structure still shows Higher Lows, but no Higher High has formed as price continues to be rejected around 4,135–4,140.
The current area is a key confluence of:
Long-term descending trendline
Horizontal resistance at 4,130–4,140
The recent swing high
RSI has eased to around 54–55, suggesting bullish momentum is fading and the market is entering a consolidation phase.
👉 Current Trend: Bearish Rejection. Selling opportunities remain favored if price continues to reject the resistance zone.
📊 2. Price Action Analysis
After rallying sharply from 4,020 to 4,137, gold failed to break above the descending trendline and has started consolidating below resistance.
Price is currently testing the 4,118–4,125 area, just beneath the descending trendline.
🔴 Resistance
4,130–4,140
4,165–4,170
4,180–4,185
🔵 Support
4,090–4,095
4,055–4,060
4,020–4,025
------------
BUY GOLD ZONE : 4057 - 4054
SL : 4049
TP : 4068 - 4082 - 4115
-------------
Trade active
M15 - buying pressure accumulating around 4110. Uptrend returns above 4120, accumulation.
MOON | Forex Academy hopes to bring the best experience to the Forex community
💠 Update the fastest news
💠 Trend analysis: XAU, BTC, Currency,...
💠My channel:
" t.me/+wmcIWR0hqD5mYjhl "
💠 Update the fastest news
💠 Trend analysis: XAU, BTC, Currency,...
💠My channel:
" t.me/+wmcIWR0hqD5mYjhl "
Related publications
Disclaimer
The information and publications are not meant to be, and do not constitute, financial, investment, trading, or other types of advice or recommendations supplied or endorsed by TradingView. Read more in the Terms of Use.