
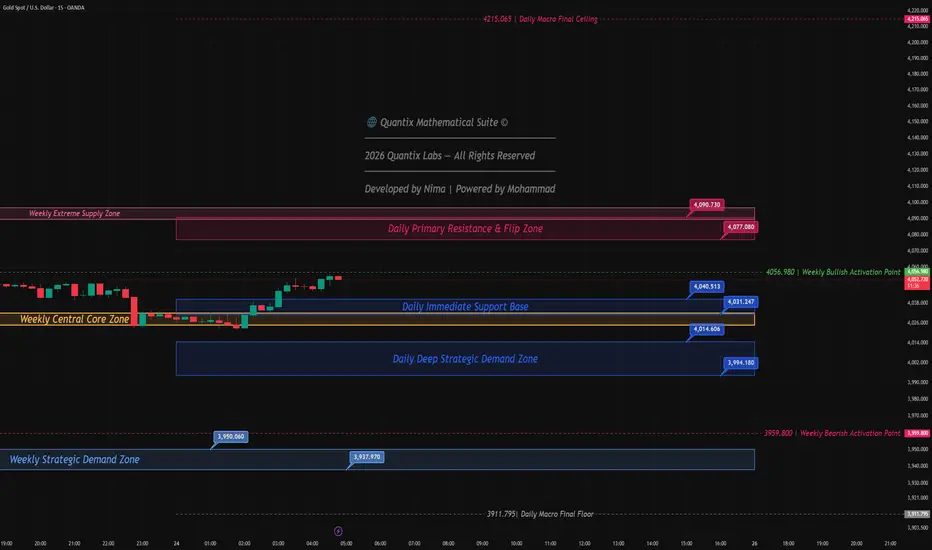
💎 XAUUSD Algo Map: Bearish Expansion & Decision Core Breakdown
📋 Report ID: XAUUSD-DAILY-2026-07-24
Asset: Gold Spot (XAU/USD)
Timeframe: Daily (Macro) / 15m (Intraday)
📊 Data Anchor: July 24, 2026 (Daily Close: July 23, 2026)
🔭 Market Context & Price Action
The daily structure for Gold (XAUUSD) has shifted into a dominant bearish expansion phase (Bearish Engulfing Body). Following a brief opening push to a high of 4141.275, institutional supply aggressively flooded the market, driving a massive drop of over $100. The asset sliced through central equilibrium metrics and closed near its low at 4049.780. Closing deeply beneath the primary decision core decisively confirms the loss of buyer control and establishes a strong bearish bias heading into the weekly close.
🎯 Key Structural Price Zones
The following zones map the absolute structural boundaries and immediate battlegrounds:
🔴 Absolute Structural Ceiling: 4215.065
This mathematically derived boundary represents the absolute maximum upward ceiling (Final Ceiling) for the macro cycle. Intermediate upper extensions reside at 4178.170 and 4171.345.
🔴 Primary Resistance & Flip Zone (Decision Core): 4077.080 - 4090.730
The critical structural fault line. This dense band combines the central computational core (4077.080), the primary algorithmic layer (4087.720), and the 50% equilibrium threshold (4090.730). Having collapsed below this zone, this former support block has transitioned into a major overhead supply barrier (Flip Zone). Higher intermediate resistance extensions sit at 4095.528 and 4105.380.
🔵 Immediate Support Base: 4031.247 - 4040.513
The primary physical floor. This zone, anchored by the session low of 4040.185 and supported by lower algorithmic boundaries at 4031.247, temporarily halted the selling cascade late in the session.
🔵 Deep Strategic Demand Zone (Discount Target): 3994.180 - 4014.606
The primary target cluster for sellers. This dense demand block incorporates lower computational boundaries spanning from 4014.606 down through 4012.885, 3999.235, and the extreme floor boundary of 3994.180.
⚫ Absolute Structural Floor: 3911.795
The ultimate underlying macro safety net (Final Floor). Extended downward targets ahead of this floor lie at 3975.990 and 3969.165.
⚖️ Order Flow & Trade Scenarios
Bearish order flow is currently dictating price action, favoring "Sell on Rally" setups:
🔴 Bearish Scenario (Primary - Sell on Rally): As long as the price remains capped beneath the 4077.080 - 4090.730 decision core, the dominant strategy is selling into corrective rallies. Any pullback into the 4067.856 - 4077.080 pivot region offers a high-probability entry for a retest of the 4040.185 physical low. A confirmed breakdown beneath 4031.247 will accelerate the expansion toward the 4014.606 and 3994.180 deep demand block.
🟢 Bullish Scenario (Structural Invalidation): To neutralize the current bearish momentum, buyers must drive price action back above the decision core, securing a confirmed daily close above 4090.730. This would invalidate the bearish setup and reopen the path toward upper supply at 4113.975 and 4139.554.
──────────────
Trade Safe and follow the structure.
◈ Quantix Labs
Trade active
💎 XAUUSD Trade Execution: Precision Snipe & Structural Reversal📋 Report ID: XAUUSD-RESULT-2026-07-24
Asset: Gold Spot (XAU/USD)
Timeframe: 15m (Intraday Execution)
Reference: XAUUSD-DAILY-2026-07-24
🎯 Trade Execution & Setup Recap
The live market session perfectly validated the primary "Sell on Rally" scenario outlined in our previous structural map. As price action pulled back into the specified pivot region just below the central core, a high-probability Short position was triggered.
Direction: Short
Risk/Reward (RR): 1:2
Entry Strategy: Sell on Rally into the lower boundary of the resistance core (Entry executed at 4073.740).
Stop Loss: Placed tightly above the immediate algorithmic layer at 4079.698.
Target (Take Profit): 4061.837, successfully exploiting the downward momentum before reaching deeper algorithmic demand.
📉 Post-Target Market Reaction & Structural Invalidation
The quantitative execution was flawless, securing the Take Profit exactly at the projected algorithmic level. However, the subsequent price action highlights the extreme importance of strict profit-taking at structural boundaries. Immediately after sweeping our target, institutional order flow violently reversed.
Buyers aggressively overwhelmed the market, initiating a massive expansion wave that effortlessly sliced upward through the 4077.080 - 4090.730 Daily Primary Resistance & Flip Zone. This explosive surge activated our previously mapped Bullish Invalidation Scenario, effectively neutralizing the macro bearish bias and opening the path to higher weekly supply clusters (pushing past 4105+).
🧠 Conclusion: The execution proves the strength of objective mapping. We successfully extracted a clean 2R profit from the bearish flow precisely before a massive structural reversal occurred, avoiding the trap that liquidated late sellers.
──────────────
Trade Safe and follow the structure.
◈ Quantix Labs

Q U A N T I X L A B S
Structure. Precision. Edge.
─────────────────────────────
Professional-grade tools for serious traders
─────────────────────────────
📊 @QuantixTrade | 💬 @Nima_Sanedoust
Structure. Precision. Edge.
─────────────────────────────
Professional-grade tools for serious traders
─────────────────────────────
📊 @QuantixTrade | 💬 @Nima_Sanedoust
Related publications
Disclaimer
The information and publications are not meant to be, and do not constitute, financial, investment, trading, or other types of advice or recommendations supplied or endorsed by TradingView. Read more in the Terms of Use.