Smart Money Concept is all about finding the liquidity.
Liquidity analysis is the essential element of profitable trading SMC.
In this article, I will teach you how to use volume indicator to identify liquidity - supply/demand clusters and hidden zones that move the market.
First, let's discuss what exactly we mean by liquidity.
Analysing any forex pair, you should know that orders of the market participants are not equally distributed among all the price levels.
While some levels and the zones will lack the interest of the market players, some will attract huge trading volumes.
We will call such zones - liquidity zones.
To find these zones, you can execute volume analysis.
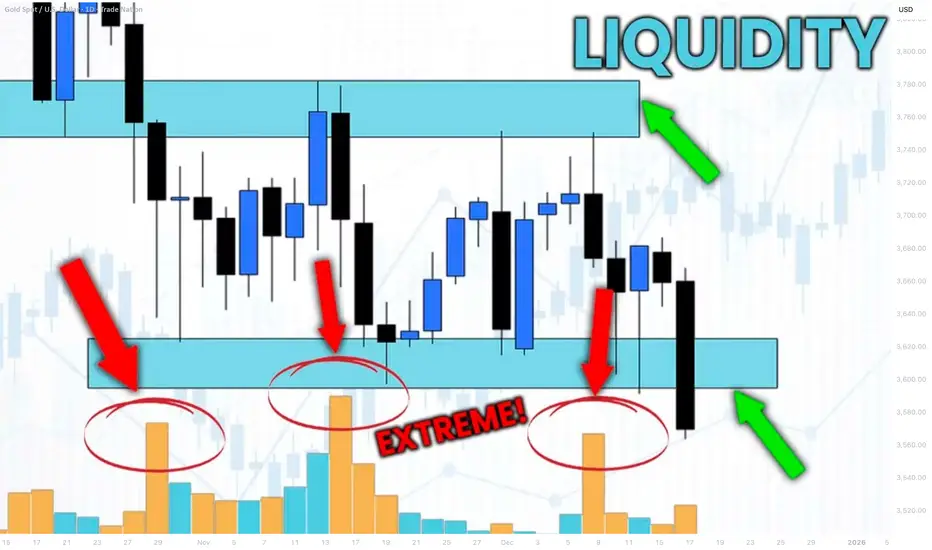
By using volume indicator, we will look for volume spikes - it will indicate strong buying and selling activity.
Examine NZDUSD chart on a daily time frame with default volume indicator being added.
I highlighted a recent volume spike.
The elevated volume level confirms that there was strong institutional participation in the formation of this candle.
But you can see that this particular candle has quite a wide rage.
So how do we know where exactly and on what levels liquidity concentrates?
We will need to use another indicator to find liquidity zones - a volume profile.
Here is what this indicator does.
Think of the chart as a battlefield. The Volume Profile shows you exactly where the major fighting between buyers and sellers is taking place. It reveals the price levels where the most orders have been executed.
While a classic volume indicator shows when volume occurred, it lights up the specific price levels where the most trading activity is concentrated.
Analyzing Volume Profile on NZDUSD, we can easily find the exact zone where liquidity was concentrated.
We simply take the entire range of a high volume candle and look for a volume profile spike within.
To identify other liquidity zones, continue searching for volume spikes in Volume indicator.
By the way, adding a Simple Moving Average on your Volume indicator will help you find these spikes easier.
Here are 4 significant liquidity zones that I found using this method.
Please, note that there are 3 high volume candles that were formed within the same liquidity zone.
A combination of a classic Volume indicator and Volume Profile will help you to accurately identify the exact moments of volume increase and the price levels where this rise occurred.
That will be a reliable strategy to find important liquidity zones.
❤️Please, support my work with like, thank you!❤️
I am part of Trade Nation's Influencer program and receive a monthly fee for using their TradingView charts in my analysis.
Note
Check my new educational article:
✅Join My Telegram Channel: t.me/VasilyTrading
❗️YouTube Channel youtube.com/c/VasilyTrader
✅ Facebook: facebook.com/VasilyTrading/
⭐ My Forex & Gold Broker: bit.ly/vasilyforexbroker ⭐
❗️YouTube Channel youtube.com/c/VasilyTrader
✅ Facebook: facebook.com/VasilyTrading/
⭐ My Forex & Gold Broker: bit.ly/vasilyforexbroker ⭐
Related publications
Disclaimer
The information and publications are not meant to be, and do not constitute, financial, investment, trading, or other types of advice or recommendations supplied or endorsed by TradingView. Read more in the Terms of Use.