The past days i have been overthinking about what Bitcoin' might do, trying to solve a puzzle that might have been going on. The drop we had on the 21th to 3920 made it quite clear we would see another drop happening, completing an ABC correction wave. But the next day i was starting to have doubts because the OI simply kept rising, eventually even making a new high. In combination with that the price was moving too stable for what i am used to, i decided to stay more neutral. Thinking a double bottom might play out, which it almost did (yellow circle). There was a bounce up there, but the bulls were to weak and the bears simply distributed more there. So that was a sign that the bulls were failing.
The OI has helped me many times with finding good turning points or seeing certain moves happening upfront, but in this case it got me on the wrong foot. Even though the drop was quite small, normally i take a step back from an asset when i have a misread like this. But to be able to provide you with my thoughts on the market, i will try to be as objective as i can.
So, when assuming this correction was an ABC, we can assume it has been completed already or very close to it. Determining support zones now is a tricky one, because there are so many levels between the 3900/3670. To be give more clarity, i think the 3820/40 is a zone that must hold to prevent a drop to the 3700ish. A realistic scenario now would be, seeing another move up to 3900/20 to complete this bear flag and than continue the drop. Now it comes of course, will this be another bear flag giving a 100 point drop or will be it something else? From my experience, a second bear flag is less reliable than the first one and the third one less than the second one. So, if we see a drop but seeing it slow down around the 3830, there is a good chance we will see something like the blue line. Seeing pos divergence on the lower time frame that can create a bounce up. Now pos div is usually not a big turning point but more like a temp one. Because of this, i have drawn a possible double bottom. So seeing a bounce up from the pos div and than retest the support to see if it is real or not.
When zooming out, we can see a clear uptrend has been broken. I am looking at it as a channel, because i don't like the shape of a wedge that much. It doesn't make a big difference though. If it is a wedge, there is room for a move up towards the 3960/4000 (red line) even to seeing resistance again there and THEN seeing a real big drop happen. A retest like this is normal for a wedge. As you can see, i think the 3700ish could be a big support zone and if this one breaks, i think we can drop all the way back to around 3500 even.
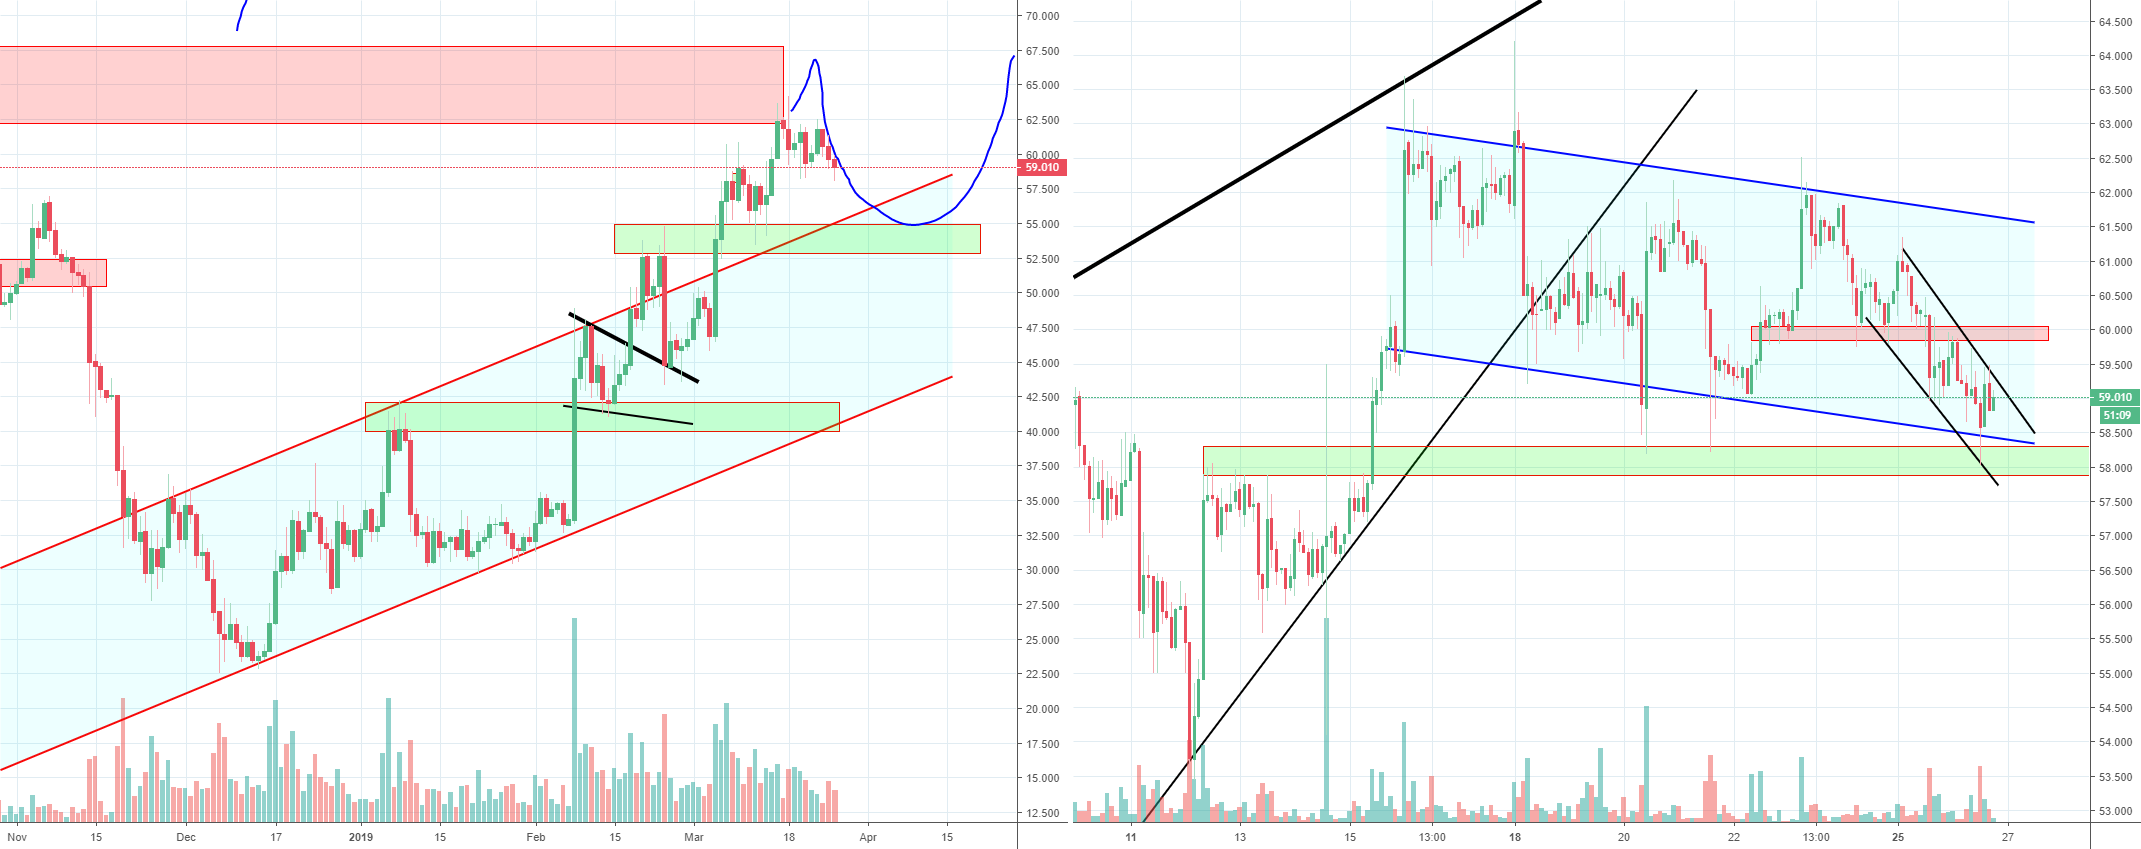
Now something else that keeps bugging me a bit. When looking back at previous drops, as we can see on the right and the chart here below. The other 2 similar moments, the whole world could see those up trend lines. But those times, it was almost impossible to short it, since those dumps happened in seconds/minutes. Now what makes me doubt is, how come this time everyone gets the perfect chance to short it here? Maybe a reason is because the OI is this high, because that also means a lot of people have positions running, so certain levels will be defended. Something we have seen a lot past weeks actually.

As i am writing this, it already made a small bounce above 3900, so we could see the bear flag getting completed now. For the bear flag to stay real, it should stay below the 3930 (max 3940). A break of 4000 would take away the bearish pressure again.
Previous analysis:
The OI has helped me many times with finding good turning points or seeing certain moves happening upfront, but in this case it got me on the wrong foot. Even though the drop was quite small, normally i take a step back from an asset when i have a misread like this. But to be able to provide you with my thoughts on the market, i will try to be as objective as i can.
So, when assuming this correction was an ABC, we can assume it has been completed already or very close to it. Determining support zones now is a tricky one, because there are so many levels between the 3900/3670. To be give more clarity, i think the 3820/40 is a zone that must hold to prevent a drop to the 3700ish. A realistic scenario now would be, seeing another move up to 3900/20 to complete this bear flag and than continue the drop. Now it comes of course, will this be another bear flag giving a 100 point drop or will be it something else? From my experience, a second bear flag is less reliable than the first one and the third one less than the second one. So, if we see a drop but seeing it slow down around the 3830, there is a good chance we will see something like the blue line. Seeing pos divergence on the lower time frame that can create a bounce up. Now pos div is usually not a big turning point but more like a temp one. Because of this, i have drawn a possible double bottom. So seeing a bounce up from the pos div and than retest the support to see if it is real or not.
When zooming out, we can see a clear uptrend has been broken. I am looking at it as a channel, because i don't like the shape of a wedge that much. It doesn't make a big difference though. If it is a wedge, there is room for a move up towards the 3960/4000 (red line) even to seeing resistance again there and THEN seeing a real big drop happen. A retest like this is normal for a wedge. As you can see, i think the 3700ish could be a big support zone and if this one breaks, i think we can drop all the way back to around 3500 even.
Now something else that keeps bugging me a bit. When looking back at previous drops, as we can see on the right and the chart here below. The other 2 similar moments, the whole world could see those up trend lines. But those times, it was almost impossible to short it, since those dumps happened in seconds/minutes. Now what makes me doubt is, how come this time everyone gets the perfect chance to short it here? Maybe a reason is because the OI is this high, because that also means a lot of people have positions running, so certain levels will be defended. Something we have seen a lot past weeks actually.
As i am writing this, it already made a small bounce above 3900, so we could see the bear flag getting completed now. For the bear flag to stay real, it should stay below the 3930 (max 3940). A break of 4000 would take away the bearish pressure again.
Previous analysis:

Comment:
Possible fractal for Bitcoin :)

Comment:
New Litecoin analysis:
Comment:
Starting to hang a long time at the high of this bear flag now. Volume is still very low, but normally we should have seen some rejection already. ETH is also looking like it want's to break up. For Bitcoin it seems the 3920 can trigger a small reaction now. If we break the 3930 with a max of 3940, than the bear flag will be invalidated. Taking away the weight of the flag and bringing the odds to 50/50 again instead of the bears having the upper hand with the bear flag.
Comment:
Bey Bey bear flag, welcome next big resistance zone. Bulls are trying something here now it seems. The bear flag is off the table now, but now it is approaching an even bigger challenge, getting above the 3970. Actually even up to the 4000ish will be a heavy road.
ETH popped a bit, also against a big and important resistance zone now
ETH popped a bit, also against a big and important resistance zone now
Comment:
Sorry, wrong chart :)
Comment:
Some very big buys pushed the price straight through that resistance. There was even a market buy of 8mil eating up that big sell wall around 3940. But still not in the clear. As mentioned in my analysis, the 4000 is a level to break. Anything below that level, can still be seen as a retest.
Open Intrest dropped 30 mil on this move up, so it shows that a good chunk of the volume was a short squeeze. This is usually not a good sign, but 30 mil is not a big number.
So i think for this move to be real, it needs to stay above the 3950ish from now on. Below that level, could mean the whole move was nothing more than a short squeeze (shake out)
Comment:
Looks like bulls are really pushing now. Broke one resistance after the other, all with small bull flags that never got in danger. So wondering where the bears are at now. I would say, it's better for the bulls to slow down a bit and consolidate now above the 3980/4000.
Wondering how much fomo will get in if it gets above the 4100. Most of the people were looking down, for very obvious reasons btw!. I can see OI has dropped as well, so that shows shorts have been closing (and of course longs as well, always both sides).
While i am writing this, funding on bitmex is about the end as well, so could see some selling pressure getting in again. Now it's just up to the bulls to keep it above the 4000ish.
When looking at the daily, we are halfway, so 12 hours more for increase in volume and price to create a big buy signal or to remain in the 50 yard zone. Selling is happening now, seeing an attempt for a Bart move but so far not as strong as they normally are. If it will be a Bart, it may extend to 3960/70ish, as we can see happened more in the past weeks, but were failed attempts of the bears
Comment:
Just got back again and the last 10 min i think i saw what looks like spoofing on Bitmex on the sell side. So it seems like some are trying to hold the price to be able to close shorts at decent prices. OI is dropping a bit as well so that confirms that thought.
To keep things simple, this triangle support has to hold now. If the 3985ish breaks the 3960ish can give support as well. In theory the 3920 should give support also, but i think that if the bulls give away too much ground (so a break of 3960/50), i think they will take over again and we will probably break the 3880. So, the 3990 and 3960 have to hold.
On the right the bigger picture, we can see the price reached a triple resistance now. Those 2 lines and the 4040ish being a big resistance zone from past week. So even though i think the bears will be in play until 4100ish, a break of 4050 will probably already mean another wave up. But think would be best if we see the price hang in the 3980/4040 range for another 24 hours.
Comment:
New Bitcoin analysis:

Want to support me? My affiliates:
partner.bybit.com/b/botje12
onelink.to/quantfury
Add invite code AFTER signing up, bonus up to $250: 4JU345F3
1 trade, 30 day wait, to claim bonus
www.kucoin.com/r/af/rMQN2A5
partner.bybit.com/b/botje12
onelink.to/quantfury
Add invite code AFTER signing up, bonus up to $250: 4JU345F3
1 trade, 30 day wait, to claim bonus
www.kucoin.com/r/af/rMQN2A5