
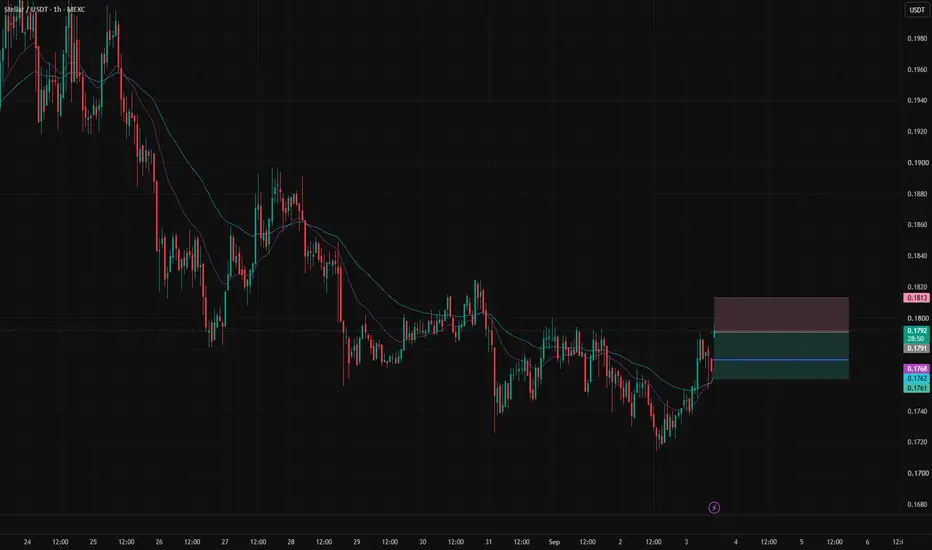
🎯 TP1: $0.177293 (+0.86%) │ TP2: $0.176140 (+1.50%)
🛑 SL: $0.181275 (-1.37%) │ R/R: 1 : 1.1
⚠️ SL is placed beyond the nearest candle wicks to reduce the risk of accidental triggering
FUNDAMENTAL BACKGROUND
The XLM/USDT market is moving primarily under the influence of a general decline in risk appetite. Despite the long-term growth of RWA assets on the Stellar network to $4 billion, current project news lacks strong catalysts. The altseason index at 26/100 confirms the weakness of altcoins, while tensions between the US and Iran are intensifying capital outflows from the crypto market. Tomorrow, 09/04/2026, US employment data (NFP) is expected to be released, with a forecast of +55K new jobs compared to the previous -23K, which could increase volatility.
TECHNICAL PICTURE
ADX 17.6 indicates a weak trend with a slight advantage for buyers, but the EMA 20 and EMA 50 are converging at $0.18, forming a resistance zone. MACD shows a neutral position with zero values for the main line and signal. The current price of $0.178830 is in the middle of the range ($0.171250–$0.182400), limiting the potential for movement without a strong impulse.
PROBABILITY MODEL
The probability of a bearish reversal is 38%, with a 37% chance of consolidation. Model confidence is 50%, reflecting the ambiguity of technical signals amid a weak trend.
DIRECTION
🔴 SELL — resistance at the EMA 20 and EMA 50 levels limits upside potential.

Disclaimer
The information and publications are not meant to be, and do not constitute, financial, investment, trading, or other types of advice or recommendations supplied or endorsed by TradingView. Read more in the Terms of Use.
Disclaimer
The information and publications are not meant to be, and do not constitute, financial, investment, trading, or other types of advice or recommendations supplied or endorsed by TradingView. Read more in the Terms of Use.