
Hi traders,
The Setup: Monthly Support Base
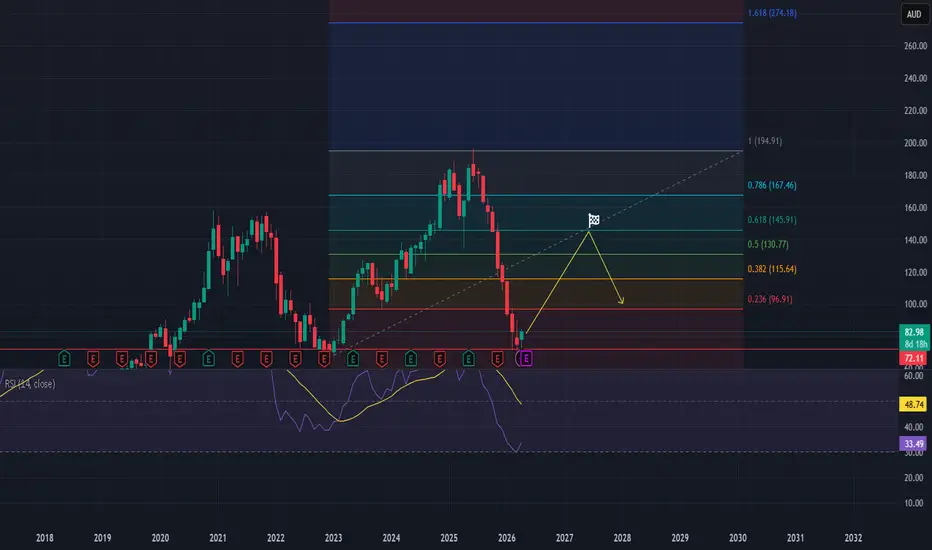
The monthly chart shows that XRO has returned to a massive structural support zone (the red line at $72.11) that dates back to 2019–2020. This "full circle" correction has reset the technicals, allowing for a long-term swing trade toward the 61.8% retracement level.
The Logic: After a 65% drop from the all-time highs, the stock is carving out a monthly bottom. The RSI (14) on your chart is sitting at 33.49, which is near historical "floor" levels for this asset.
The Goal: We are riding the recovery wave from the current oversold levels up to the Golden Pocket ($130.77 – $145.91), where sellers are expected to return.
Execution Parameters
Entry Strategy
The current price of $82.98 is a valid entry point for a long-term position, as it sits just above the primary monthly support. If you are looking for a "perfect" entry, any retest of the $72.00 – $75.00 range provides an even better risk-adjusted opportunity.
Risk Management (Stop Loss)
The protective stop should be placed at $66.50. This is below the recent 52-week low and the structural red line. A monthly close below this level would signal that the macro uptrend has completely failed.
Take Profit Targets
Primary Target (The Golden Pocket): $130.77. This is the 0.5 Fibonacci level and the start of the "Golden Pocket" (between 0.5 and 0.618). Your "checkered flag" on the chart is placed exactly here.
Secondary Target: $145.91. The 0.618 Fibonacci level, which often acts as the final exhaustion point for a corrective rally.
Market Context (April 2026)
Earnings Catalyst: Xero is scheduled to report its FY26 Full Year Results on May 13, 2026. The market is currently pricing in a 22% growth in earnings. A positive surprise here could be the engine that starts the move toward your $130 target.
Valuation Reset: With the P/E ratio having compressed significantly during the 2026 tech sell-off, XRO is no longer just a "growth at any price" play; it’s becoming a "value-growth" hybrid, which attracts institutional buyers at these monthly support levels.
Risk/Reward Summary
Risk: ~$16.48 per share (from an $82.98 entry).
Reward: ~$47.79 per share (to the $130.77 target).
R/R Ratio: 1:2.9
On a monthly timeframe, this is a "patience play." You are looking for a multi-month recovery rather than a quick scalp.

💥 Free signals and ideas ➡ t.me/vfinvestment
Disclaimer
The information and publications are not meant to be, and do not constitute, financial, investment, trading, or other types of advice or recommendations supplied or endorsed by TradingView. Read more in the Terms of Use.
💥 Free signals and ideas ➡ t.me/vfinvestment
Disclaimer
The information and publications are not meant to be, and do not constitute, financial, investment, trading, or other types of advice or recommendations supplied or endorsed by TradingView. Read more in the Terms of Use.