Understanding the Head & Shoulders Breakdown
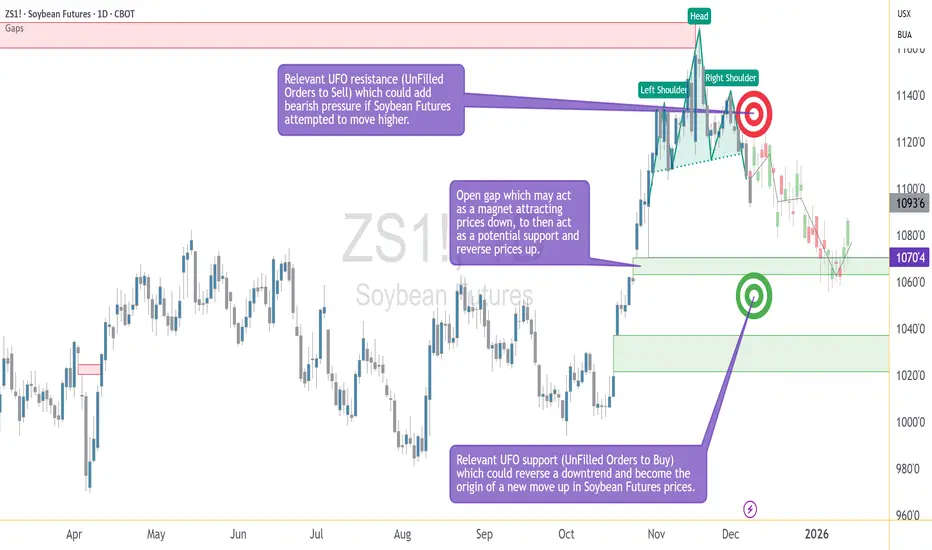
A bearish head and shoulders pattern gives traders a structured way to define entries and exits using price geometry rather than emotion. The pattern forms when a market transitions from strength to distribution, creating a left shoulder, a higher head, and then a lower right shoulder as momentum begins to fade. The neckline acts as the key support level that separates a developing pattern from a completed one.
In the case study illustrated on the chart, the daily timeframe shows a fully developed head and shoulders structure that confirmed during the December 5 trading session, when price closed below the neckline. This type of close is often interpreted by traders as evidence that bearish participation has taken control of the pattern. Whether a trader enters immediately or waits for a retest, the priority becomes identifying the levels that will structure the trade: the area of invalidation, the downside objective, and the points where risk must be controlled.
A confirmed neckline break does not imply certainty about future price direction. Instead, it provides an organized framework—a map traders can use to define where their idea is considered valid and where it is considered invalid. The educational value of this pattern lies not in its ability to predict, but in its ability to help traders pre-plan actions with clarity.
Structuring the Bearish Entry: Neckline Retests and Resistance Zones
One of the most common approaches to trading a bearish head and shoulders is to monitor for a modest bounce back toward the neckline after the breakdown. Retests do not always occur, but when they do, many traders see them as opportunities to enter with more control over the distance between entry and stop.
In this example, price sits beneath a well-defined UFO resistance area between 1123 and 1136. This band aligns with a cluster of unfilled sell orders, which may reinforce bearish pressure if price attempts to climb. More importantly, the upper boundary of the zone—1136—serves as an objective point of invalidation. If price were to move above that level, the logic of the completed bearish structure would no longer hold. Therefore, traders could use this upper boundary as a stop-loss level. It is neither arbitrary nor emotional; it is derived directly from the structure.
This type of predefined invalidation is essential because even the cleanest technical patterns can fail. The purpose of using a pattern is not to guarantee the outcome, but to know exactly when the trade thesis no longer makes sense. In this framework, the neckline provides context for the entry, while the resistance zone provides clarity for where the idea is wrong.
Defining the Target: Gap Alignment and Technical Confluence
After establishing where a trade becomes invalid, traders turn to the question of where it becomes complete. In pattern-based trading, target selection often blends classical measurement rules with the identification of technical areas where price has reason to react. In this case study, the downside objective centers on 1070'4, where two important elements align.
First, there is an open gap at this price level. Gaps frequently attract price because they represent prior imbalances in trading activity—areas where the market moved too quickly for participants to fully transact. When price revisits such a location, it becomes a zone where activity may increase. Second, the gap coincides with a region of unfilled buy orders that may serve as a UFO support area. When gaps and demand zones overlap, the confluence strengthens the rationale for using the level as a target.
Because the bearish pattern is already confirmed, traders using this structure may calculate a reward-to-risk ratio by comparing the distance from the entry zone to the stop (near 1136) and the distance from the entry zone to the target (1070'4). The role of the target is not to predict where price will go, but to anchor the trade in a predefined and measurable plan. It transforms the setup into a risk-managed scenario rather than an open-ended directional hope.
Understanding Contract Specs, Margin, and Risk Management
Traders using standardized futures contracts must structure their decisions around contract size, tick value, and margin requirements. The chart example in this idea uses the standard ZS contract, which represents 5,000 bushels. The micro contract (MZS) represents 500 bushels. This difference directly affects position sizing and the dollar impact of each tick. Because margin requirements vary over time, traders should always check the latest values before entering any position.
Tick (Minimum Price Fluctuation:
Current Margin Requirements:
A key benefit of having two contract sizes available is flexibility. Traders seeking to maintain disciplined risk parameters often use micro contracts to fine-tune exposure, ensuring that the stop-loss level does not exceed their predefined risk tolerance. The objective of the head and shoulders pattern is not merely to identify a direction but to help traders organize their plan around risk boundaries. Knowing the contract’s characteristics enables the trader to size positions correctly.
Risk management remains the foundation of pattern-based approaches. Price can behave unpredictably, even when the chart seems decisive. This is why traders emphasize position sizing, controlled leverage, and strict adherence to the stop-loss level. The goal is not to avoid losses entirely but to keep them manageable and consistent. A well-constructed head and shoulders strategy relies not only on identifying the pattern but on respecting the risk parameters that accompany it.
Bringing It All Together: Structure, Context, and Discipline
The chart included in this idea illustrates the essential elements of the bearish head and shoulders setup: the left shoulder, head, and right shoulder; the neckline break; the gap at 1070'4; and the resistance band between 1123 and 1136. These levels form the backbone of a structured trading plan. Rather than reacting to market movement in real time, traders can use these predefined reference points to guide decision-making with consistency.
The purpose of this article is educational. It demonstrates how entries, exits, and risk parameters can be structured around a classical bearish head and shoulders pattern, how confluence strengthens downside targets, and how contract specifications help traders align position size with their risk tolerance. Above all, it shows that disciplined planning matters more than attempting to anticipate every price movement.
When charting futures, the data provided could be delayed. Traders working with the ticker symbols discussed in this idea may prefer to use CME Group real-time data plan on TradingView: tradingview.com/cme/ - This consideration is particularly important for shorter-term traders, whereas it may be less critical for those focused on longer-term trading strategies.
General Disclaimer:
The trade ideas presented herein are solely for illustrative purposes forming a part of a case study intended to demonstrate key principles in risk management within the context of the specific market scenarios discussed. These ideas are not to be interpreted as investment recommendations or financial advice. They do not endorse or promote any specific trading strategies, financial products, or services. The information provided is based on data believed to be reliable; however, its accuracy or completeness cannot be guaranteed. Trading in financial markets involves risks, including the potential loss of principal. Each individual should conduct their own research and consult with professional financial advisors before making any investment decisions. The author or publisher of this content bears no responsibility for any actions taken based on the information provided or for any resultant financial or other losses.
A bearish head and shoulders pattern gives traders a structured way to define entries and exits using price geometry rather than emotion. The pattern forms when a market transitions from strength to distribution, creating a left shoulder, a higher head, and then a lower right shoulder as momentum begins to fade. The neckline acts as the key support level that separates a developing pattern from a completed one.
In the case study illustrated on the chart, the daily timeframe shows a fully developed head and shoulders structure that confirmed during the December 5 trading session, when price closed below the neckline. This type of close is often interpreted by traders as evidence that bearish participation has taken control of the pattern. Whether a trader enters immediately or waits for a retest, the priority becomes identifying the levels that will structure the trade: the area of invalidation, the downside objective, and the points where risk must be controlled.
A confirmed neckline break does not imply certainty about future price direction. Instead, it provides an organized framework—a map traders can use to define where their idea is considered valid and where it is considered invalid. The educational value of this pattern lies not in its ability to predict, but in its ability to help traders pre-plan actions with clarity.
Structuring the Bearish Entry: Neckline Retests and Resistance Zones
One of the most common approaches to trading a bearish head and shoulders is to monitor for a modest bounce back toward the neckline after the breakdown. Retests do not always occur, but when they do, many traders see them as opportunities to enter with more control over the distance between entry and stop.
In this example, price sits beneath a well-defined UFO resistance area between 1123 and 1136. This band aligns with a cluster of unfilled sell orders, which may reinforce bearish pressure if price attempts to climb. More importantly, the upper boundary of the zone—1136—serves as an objective point of invalidation. If price were to move above that level, the logic of the completed bearish structure would no longer hold. Therefore, traders could use this upper boundary as a stop-loss level. It is neither arbitrary nor emotional; it is derived directly from the structure.
This type of predefined invalidation is essential because even the cleanest technical patterns can fail. The purpose of using a pattern is not to guarantee the outcome, but to know exactly when the trade thesis no longer makes sense. In this framework, the neckline provides context for the entry, while the resistance zone provides clarity for where the idea is wrong.
Defining the Target: Gap Alignment and Technical Confluence
After establishing where a trade becomes invalid, traders turn to the question of where it becomes complete. In pattern-based trading, target selection often blends classical measurement rules with the identification of technical areas where price has reason to react. In this case study, the downside objective centers on 1070'4, where two important elements align.
First, there is an open gap at this price level. Gaps frequently attract price because they represent prior imbalances in trading activity—areas where the market moved too quickly for participants to fully transact. When price revisits such a location, it becomes a zone where activity may increase. Second, the gap coincides with a region of unfilled buy orders that may serve as a UFO support area. When gaps and demand zones overlap, the confluence strengthens the rationale for using the level as a target.
Because the bearish pattern is already confirmed, traders using this structure may calculate a reward-to-risk ratio by comparing the distance from the entry zone to the stop (near 1136) and the distance from the entry zone to the target (1070'4). The role of the target is not to predict where price will go, but to anchor the trade in a predefined and measurable plan. It transforms the setup into a risk-managed scenario rather than an open-ended directional hope.
Understanding Contract Specs, Margin, and Risk Management
Traders using standardized futures contracts must structure their decisions around contract size, tick value, and margin requirements. The chart example in this idea uses the standard ZS contract, which represents 5,000 bushels. The micro contract (MZS) represents 500 bushels. This difference directly affects position sizing and the dollar impact of each tick. Because margin requirements vary over time, traders should always check the latest values before entering any position.
Tick (Minimum Price Fluctuation:
- ZS: 1/4 of one cent (0.0025) per bushel = $12.50 per contract
- MZS: 0.0050 per bushel = $2.50 per contract
Current Margin Requirements:
- ZS: $2,000 per contract
- MZS: $200 per contract
A key benefit of having two contract sizes available is flexibility. Traders seeking to maintain disciplined risk parameters often use micro contracts to fine-tune exposure, ensuring that the stop-loss level does not exceed their predefined risk tolerance. The objective of the head and shoulders pattern is not merely to identify a direction but to help traders organize their plan around risk boundaries. Knowing the contract’s characteristics enables the trader to size positions correctly.
Risk management remains the foundation of pattern-based approaches. Price can behave unpredictably, even when the chart seems decisive. This is why traders emphasize position sizing, controlled leverage, and strict adherence to the stop-loss level. The goal is not to avoid losses entirely but to keep them manageable and consistent. A well-constructed head and shoulders strategy relies not only on identifying the pattern but on respecting the risk parameters that accompany it.
Bringing It All Together: Structure, Context, and Discipline
The chart included in this idea illustrates the essential elements of the bearish head and shoulders setup: the left shoulder, head, and right shoulder; the neckline break; the gap at 1070'4; and the resistance band between 1123 and 1136. These levels form the backbone of a structured trading plan. Rather than reacting to market movement in real time, traders can use these predefined reference points to guide decision-making with consistency.
The purpose of this article is educational. It demonstrates how entries, exits, and risk parameters can be structured around a classical bearish head and shoulders pattern, how confluence strengthens downside targets, and how contract specifications help traders align position size with their risk tolerance. Above all, it shows that disciplined planning matters more than attempting to anticipate every price movement.
When charting futures, the data provided could be delayed. Traders working with the ticker symbols discussed in this idea may prefer to use CME Group real-time data plan on TradingView: tradingview.com/cme/ - This consideration is particularly important for shorter-term traders, whereas it may be less critical for those focused on longer-term trading strategies.
General Disclaimer:
The trade ideas presented herein are solely for illustrative purposes forming a part of a case study intended to demonstrate key principles in risk management within the context of the specific market scenarios discussed. These ideas are not to be interpreted as investment recommendations or financial advice. They do not endorse or promote any specific trading strategies, financial products, or services. The information provided is based on data believed to be reliable; however, its accuracy or completeness cannot be guaranteed. Trading in financial markets involves risks, including the potential loss of principal. Each individual should conduct their own research and consult with professional financial advisors before making any investment decisions. The author or publisher of this content bears no responsibility for any actions taken based on the information provided or for any resultant financial or other losses.
🌟 Take This Analysis Further with Our AI Scripts 🎯 | Discover How at tradewithufos.com 🚀 Choose a Subscription: Monthly ᴼᴿ Yearly ᴼᴿ Lifetime 🗓️ | Unlock Intelligent UFO Scripts Free 💡
Related publications
Disclaimer
The information and publications are not meant to be, and do not constitute, financial, investment, trading, or other types of advice or recommendations supplied or endorsed by TradingView. Read more in the Terms of Use.