Trading Psychology: Inside the Mind of a Successful Trader🔥 Trading Psychology: Inside the Mind of a Successful Trader
⭐ 1. Why Most Traders Fail: The Battle Inside Their Own Mind
The majority of traders spend all their time trying to predict the market:
- “Will it go up or down?”
- “What if I lose this trade?”
- “What if I miss the move?”
This constant anxiety leads to emotional decisions chasing entries, closing profits too early, ignoring stoploss, overtrading…
A professional trader thinks differently:
👉 Once they enter a trade, they accept that the result is out of their control.
👉 Instead of worrying, they focus on improving their strategy and execution.
This shift in mindset separates amateurs from professionals.
⭐ 2. Avoid the Ego Trap: Overconfidence Destroys Traders
Many traders lose because they believe they are “right.”
They fall in love with their bias… and the market humbles them brutally.
A successful trader never assumes they know what the market will do.
They write everything down:
- their entry
- their exit
- their emotions
- the market structure
- what went well
- what failed
This trading journal becomes their mirror the place where REAL improvement happens.
⭐ 3. Learning From Losses: A Superpower Only Pros Have
Most retail traders quit after a few losses.
A professional trader studies those losses like gold.
Markets expose your weaknesses instantly.
A losing streak doesn’t define you — it teaches you:
- Was it a bad setup?
- Was it a psychological mistake?
- Did you violate your plan?
- Was it a normal statistical loss?
A winning trader accepts losses calmly.
Losses are information.
Information becomes experience.
Experience becomes confidence.
⭐ 4. Risk Management: Where Psychology Meets Survival
One of the most dangerous psychological traps is entering a trade even when there is no real opportunity.
Traders do this because:
- They are bored
- They fear missing out
- They want to “make back” losses
- They want to feel active in the market
But a professional trader knows:
👉 Protecting capital ALWAYS comes before making profits.
👉 You trade only when the market gives you a valid opportunity.
👉 You use stoploss not because you expect to lose, but because you respect the market.
Risk management is not technical it’s psychological discipline.
⭐ 5. Successful Traders Don’t Gamble - They Follow a Process
- Most people enter the stock or crypto market with no plan.
- They follow random advice, copy strangers online, or chase someone else’s profits.
This creates inconsistent results and emotional chaos.
A successful trader:
✔️ studies the market
✔️ researches proven strategies
✔️ practices before trading real money
✔️ learns from veteran traders
✔️ builds a personal trading system
✔️ follows that system with discipline
A system turns trading from gambling… into a professional process.
⭐ 6. The Habits That Build a Winning Trading Psychology
Here are the habits every long-term successful trader shares:
✔️ Have a trading plan and follow it strictly
It won’t guarantee profit every time, but it WILL guarantee long-term survival.
✔️ Don’t take shortcuts
Discipline is what separates consistent winners from emotional gamblers.
✔️ Don’t chase profits
The market offers opportunities daily — desperation kills clarity.
✔️ Only trade what you’re willing to lose
You can’t trade with courage if you trade with fear.
✔️ Accept losses without emotional collapse
A single trade does not define your career — your process does.
✔️ Trust your system, not your emotions
Your strategy knows more than your feelings.
🔥 Conclusion: Master Your Mind, Master the Market
To become a successful trader, psychology is everything.
You cannot control the market.
But you can control:
- your reactions
- your discipline
- your mindset
- your decisions
With the right psychology, your trading becomes calmer, more consistent, and more profitable.
Your wins become systematic.
Your losses become lessons.
And your journey becomes sustainable.
A winning psychology is not something you are born with it is something you build through habits, discipline, and time.
Trade like a professional. Think like a professional And your results will follow.
Community ideas

Trading Future - 1-Minute TimeframeTrading Future - 1-Minute Timeframe CME_MINI:MES1! CME_MINI:ES1! CME_MINI:M2K1!
RSI Low (Reversal) Entry Strategy
Spot ENTRY
Trend completed - Succeed !
Entry Criteria
✔ RSI Low alert
✔ RSI crosses above MA
✔ Price crosses above SMA9
✔ Price pullback holds SMA9
✔ Optional: Price above SMA20 for stronger confirmation
Exit Criteria
❌ Price closes below SMA9
❌ Price falls below HMA-Low (secondary exit)
❌ Price hits target below HMA-High line
Indicators Setup:
1. HMA Low/High – Length 15
Entry: Price crosses above HMA-Low and stays inside the HMA channel.
Exit: Price falls below SMA 9 OR price goes below HMA-Low line (secondary exit).
2. SMA 9 (Blue)
Entry: Price pulls back to SMA9 but does not fall under it.
Exit: Price falls under SMA9.
3. SMA 20 (Red)
Confirmation trend line.
Entry Confirmation: Price crosses above SMA20.
4. SMA 70 (Teal)
Higher-timeframe trend bias.
5. RSI (14) – Low/High 30/70
Reversal signal at RSI Low.
RSI extreme lows highlight with BG color.
6. MACD Histogram (12/26/9)
Trend confirmation: Histogram cross above 0 = momentum shift upward.
Trading Steps:
1. Identify the RSI Low (Alert)
RSI prints a lowest point and background highlights in the extreme zone.
2. RSI Crosses Above Its MA (Yellow)
RSI breaks above its MA = early upward momentum.
At the same time:
Price crosses above SMA 9 (blue).
3. Entry Trigger
Wait for a price pullback to SMA9,
BUT price must not break below SMA9.
If SMA9 holds support → Enter long.
4. Stop Loss Rules
Primary Stop Loss: Price closes below SMA 9 (blue).
Secondary Stop Loss: Price dips just under HMA-Low = early trend failure.
5. Position Hold Conditions (Confirmation)
Hold the trade ONLY IF:
Price stays above SMA 9.
MACD Histogram crosses above 0
→ Trend shifts from negative to positive, confirming upward movement.
6. Ride the Trend
Let price continue inside HMA channel.
Wait for trend to complete (usually when RSI approaches 70 or MACD weakens).
7. Profit Taking (Exit Rules)
Option A: HMA-High line target
Set take-profit just below HMA-High line.
Option B: SMA9 Breakdown
Exit when price falls below SMA 9 (blue).

TRADING CONSISTENCY - THE REAL EDGE🔁 " There is more than one way to skin a cat " - Franklin P. Jones
Here’s something most traders eventually realize:
Three different traders can take the exact same trade…
yet each one believes they’re using a completely different strategy.
For example:
• One buys off a Fair Value Gap
• One buys from a Demand Zone
• One buys at a Support Level inside that demand
Three strategies.
One entry.
Same reaction.
And once you see this, you understand something deeper:
👉 Most strategies are just different lenses that explain the same price behavior.
👉 The zone is the zone — the label doesn’t change the probability.
👉 Your real edge is consistency, not the indicator you use.
Instead of chasing “the perfect strategy,”
master one model and execute it with discipline until probabilities play out.
You’ll start noticing overlaps everywhere.
⸻
📘 What Trading in the Zone Teaches That Completes This Idea
Mark Douglas explains one of the most important truths in trading:
"Your strategy doesn’t make you profitable, your mindset does"
Here are the principles that connect perfectly with this idea:
1️⃣ The Market Is a Probabilistic Environment
You’re not predicting — you’re playing a probability game.
Different strategies often point to the same area because they all identify high-probability zones.
2️⃣ A Single Trade Means Nothing
Most traders obsess about the outcome of one trade.
But Douglas says:
“Anything can happen.”
Your job is to execute your plan flawlessly, not emotionally judge each result.
3️⃣ Consistency Comes From Thinking in Probabilities
You don’t need to be right.
You need to follow your system with the belief that the edge will manifest over a series of trades.
4️⃣ The Market Rewards the Trader Who Accepts Uncertainty
When you accept uncertainty, you stop jumping between strategies.
You stick to one model, one mindset, one approach — and you let probability do the heavy lifting.
This is exactly why strategies end up looking the same:
They all try to identify the same probabilistic behavior in different ways.
⸻
🧠 Consistency & Discipline Go Beyond Trading
Here’s the part most traders ignore:
Your trading reflects your life. If you’re inconsistent outside the charts, you’ll be inconsistent on them.
• If you break routines, you’ll break rules.
• If you avoid discomfort, you’ll avoid valid setups.
• If you chase shortcuts, you’ll hop strategies.
• If you’re emotional in daily decisions, you’ll be emotional with charts.
Everything is connected.
So how do you get better?
By improving yourself, not just your charts:
✨ Build routines and hold yourself accountable
✨ Review your trades honestly
✨ Remove distractions that create emotional reactions
✨ Train discipline through repetition
✨ Focus on process over perfection
The more consistent you are as a person,
the more consistent you become as a trader.
Trading doesn’t create discipline — it exposes whether you have it.
⸻
📜 Here are some quotes on Consistency
“ We are what we repeatedly do. Excellence, then, is not an act but a habit. ” — Aristotle
“ Success is the sum of small efforts, repeated day in and day out. ” — Robert Collier
“ Long-term consistency beats short-term intensity. ” — Bruce Lee
“ Anything can happen. ” — Mark Douglas
⸻
What about you?
Which strategy do you use that ends up being the same as another strategy without realizing it?
And how do you build consistency and discipline — in trading and in life?
Drop your thoughts below 👇
Let’s discuss.

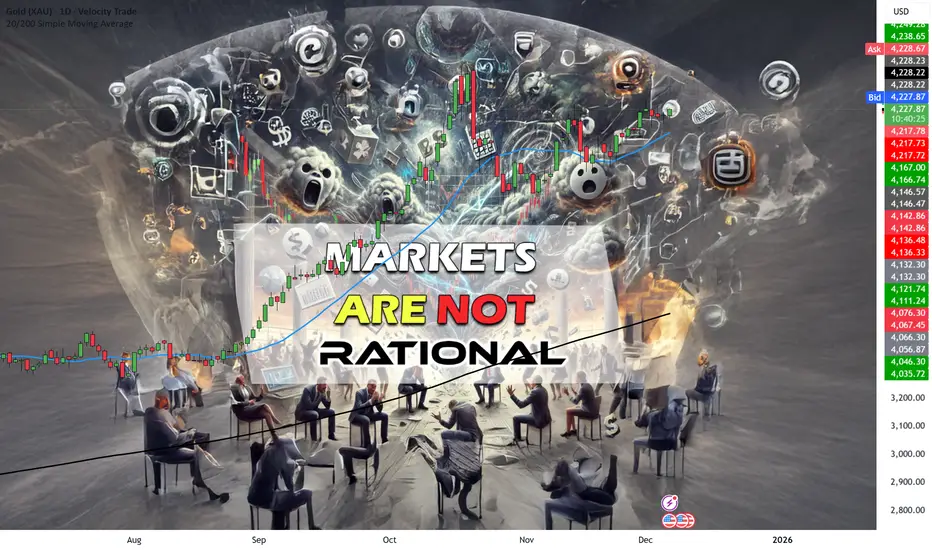
Why Markets Aren’t Always RationalWhy Markets Aren’t Always Rational
Have you ever scratched your head wondering why the stock market seems to defy logic?
Wars breakout – Markets rally such as the Dow Jones Futures
Currencies devalue – Markets rally.
Bad earnings come out – Markets rally.
Great news come out and markets crash.
Don’t worry; you’re not alone.
Traders everywhere experience that jaw-dropping moment when good news doesn’t lead to uptrends, correlations break down, or when the market’s behavior looks like one big, chaotic mess.
So, why do markets behave like this?
Let’s unpack the mystery.
The Market is One Cluster-Freak of Confusion
Let’s start with the truth no one wants to admit.
The market is not a perfect machine.
It’s not the textbook example of logic that economic theories might have you believe.
Correlations don’t work according to the book.
One day, gold and the dollar move in opposite directions.
The next day, they move in tandem. You’re left wondering if someone swapped the rule book for a comic strip.
And then there’s the disconnect between trends and fundamentals.
You dive into micro and macro analyses, only to find that a company with stellar earnings is trending down.
Meanwhile, a company with mediocre reports is rocketing to the moon.
Why? Because market participants aren’t robots.
They’re emotional, impulsive, and sometimes downright irrational.
They drive the markets with fear, greed and ego.
The market is less of a math equation and more of a mood swing.
Good News Doesn’t Always Mean Strong Uptrends
Here’s another slap in the face of logic:
Good news can sometimes trigger sell-offs.
A company beats earnings expectations, announces an exciting product, and yet—boom—the stock plummets.
What gives?
This happens because markets are driven by expectations, not just outcomes.
If the “good news” was already priced in, traders may sell to take profits.
Worse, if the news didn’t exceed sky-high expectations, the market might interpret it as a letdown.
Herd Mentality: Following the Wrong Crowd
Ever heard the phrase, “When in doubt, follow the herd”?
That’s exactly what many traders do—and it’s not always the smartest move.
Market trends often amplify irrational behavior.
If the market’s falling, traders sell in a panic. If it’s rallying, they buy in FOMO (fear of missing out).
These emotional reactions create an illusion of logic, but in reality, it’s chaos feeding on itself.
Real-life example? Meme stocks. Companies with no strong fundamentals suddenly became multi-billion-dollar rockets because traders on Reddit decided to collectively moonshot them.
Rationality?
Out the window.
How to Stay Sane in an Irrational Market
So, what can you do to navigate this madness? The key is to build your own strategy – Proven, profitable and consistent through MOST market environments.
Avoid getting swept up in market noise.
Understand market psychology.
Accept that emotions drive the market just as much as fundamentals do.
Be cautious with correlations. Test them, but don’t bet the farm on them. Remember, markets love to break their own rules.
Don’t rely solely on good news. Always ask yourself: Is this already priced in? What are the broader market expectations?
Think long-term.
The daily market irrationality tends to smooth out over time. Focus on the bigger picture rather than short-term hiccups.
FINAL WORDS:
When you have your edge – then the markets irrationality become irrelevant to your trading success.
Markets often appear irrational due to emotional participants and unpredictable trends.
Let’s sum up what we have covered:
Correlations don’t always follow the “rules.”
Good news doesn’t guarantee uptrends; expectations and psychology matter more.
Herd mentality amplifies irrational moves.
Stay grounded, think critically, and focus on long-term strategies.
The market may be a cluster-freak of confusion, but with the right mindset, you can navigate the chaos like a pro.
Now, let’s tackle that beast head-on!
7 Tips for Portfolio Growth in TradingWe need to constantly feed out portfolios to help it grow and accelerate.
Consistency is key!
Whether you’re trading the JSE Top 40 to the Dow Jones Index – You need to show you’re consistent with each market.
One simple (but often overlooked) habit is depositing extra funds into your portfolio regularly.
Whether it’s every month or twice a year, this seemingly small step can create a snowball effect for your portfolio’s performance.
But don’t stop there. Let’s dive into 10 actionable tips to take your portfolio growth to the next level.
Deposit Consistently, No Matter What
Think of your trading account like a savings account on steroids.
Commit to depositing a portion of your income every month or at least every six months. The more fuel (capital) you add, the bigger your fire (portfolio) can grow.
Even small, regular deposits add up over time. Start with what you can afford, and increase it as your income or confidence grows.
Reinvest Your Profits
Don’t spend your trading profits on frivolous stuff—at least not all of it!
Reinvesting your gains is like planting seeds from a harvest.
Instead of withdrawing every win, let the power of compounding work its magic.
The bigger your capital, the more opportunities you’ll have to trade and profit.
Have a Risk Management Plan
Growth doesn’t mean taking unnecessary risks. In fact, the fastest way to shrink a portfolio is by failing to manage your losses.
Stick to the golden rule: never risk more than 1-2% of your total portfolio on a single trade.
You’ll stay in the game longer, and consistency will help your portfolio thrive.
Scale Up Your Position Sizes (Wisely)
As your portfolio grows, so should your position sizes.
But here’s the kicker—only scale up when your strategy proves consistent.
If you’re consistently hitting a 60%+ win rate, increase your position sizes incrementally.
This way, your gains grow proportionally while keeping risk manageable.
Avoid Overtrading
More trades don’t always mean more profits. In fact, overtrading is a silent portfolio killer.
Stick to your plan, and only trade setups that meet your criteria. Think quality over quantity. A patient trader is often a profitable one.
Track Your Performance Religiously
You can’t improve what you don’t measure.
Maintain a trading journal to track every trade, deposit, and withdrawal.
Review your performance weekly or monthly. Identify what’s working, what’s not, and adjust accordingly. Growth thrives on self-awareness!
Stay Mentally Sharp and Emotionally Disciplined
Let’s face it: trading can be an emotional rollercoaster.
But emotional decisions are often bad decisions.
Maintain a clear mind by sticking to your strategy and not chasing losses or revenge trading. Remember, a calm trader is a winning trader.
Bonus Tip: Practice mindfulness or take breaks when needed. Your portfolio will thank you.
Final words:
To grow a consistent portfolio, we need to adapt to important tips and elements.
Let’s sum up the 7 important ones to grow a portfolio.
Deposit Consistently, No Matter What
Reinvest Your Profits
Have a Risk Management Plan
Scale Up Your Position Sizes (Wisely)
Avoid Overtrading
Track Your Performance Religiously
Stay Mentally Sharp and Emotionally Disciplined

HOW TO WATCHLIST TABLE-VIEW VOLUME & EXTENDED HOURSComplete Process: HOW TO WATCHLIST TABLE-VIEW VOLUME & EXTENDED HOURS
1️⃣ Open the Watchlist Panel
➺ The Watchlist panel is located on the right side of the Trading-View interface.
➺ If it is hidden, click the small arrow on the right edge to open it.
2️⃣ Locate the Table-View Tool
➺ At the top of the watchlist panel, you will see three dot icon.
➺ This icon opens the table-view tool inside the watchlist.
3️⃣ Open the Table-View
Step-by-step:
➺ Click the table icon at the bottom of the watchlist.
➺ The watchlist will switch from the normal list-view to the table-view layout.
4️⃣ Understanding the Table-View Layout
The table-view displays additional columns and organized data in a tabular format.
Typical columns include:
⤷ Symbol
⤷ Last Price
⤷ Change (%)
⤷ Volume
⤷ High / Low
⤷ Session Data
⤷ Custom fields (depending on settings)
The table-view allows users to compare multiple symbols more clearly.
5️⃣ How to Add Columns in Table-View
Step-by-step:
➺ Hover on the column header area.
➺ Click the plus (+) icon or “Add Column” option.
➺ Choose the data you want to add:
⤷ Price
⤷ Change
⤷ Bid / Ask
⤷ Volume
⤷ Open Interest
⤷ Fundamentals (if supported)
⤷ Other available fields
The selected column will appear immediately.
6️⃣ How to Remove Columns
Step-by-step:
➺ Hover over the column header you want to remove.
➺ Click the three-dot menu (⋮) on that column.
➺ Select “Remove Column”.
➺ The column will be removed from the table.
7️⃣ How to Reorder Columns
Step-by-step:
➺ Click and hold the column header.
➺ Drag it left or right.
➺ Release to place it in the new position.
This helps personalize the table layout.
8️⃣ Sorting Symbols in Table-View
Step-by-step:
➺ Click any column name (for example: Price, Change %, Volume).
➺ Clicking once sorts the column ascending.
➺ Clicking again sorts descending.
➺ A small arrow appears showing the sort direction.
9️⃣ Switch Back to Normal Watchlist View
Step-by-step:
➺ Click the same table icon at the bottom again.
➺ The watchlist returns to the default list-view.
🎯 Short Summary (Optional for Captions)
⤷ Open Table-View → Bottom table icon
⤷ Add Columns → Add Column option
⤷ Remove Columns → Three-dot menu → Remove
⤷ Reorder → Drag column headers
⤷ Sort → Click column name
⤷ Return to List → Click table icon again

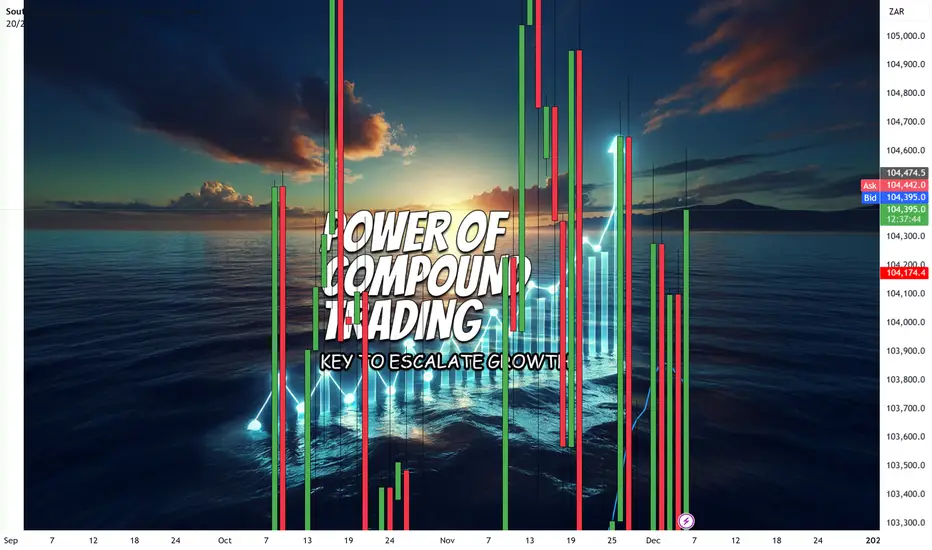
Compounding: The key to Market GrowthCompound Interest
Some call it the “eighth wonder of the world.”
But what makes it so powerful?
Why does it help escalate your portfolio at a faster rate?
And why should you care about it as a trader or investor?
In this article, we’ll unpack how compounding can accelerate your market growth, protect your portfolio from inflation, and secure your financial future. Ready to supercharge your trading game?
Let’s dive in.
Understanding Compounding: Why It’s the Powerhouse of Wealth Creation
Imagine this: You plant a single apple tree.
In a year, it bears fruit, and you get a few apples.
But rather than just enjoying those apples, you plant the seeds from each one.
Before you know it, you have a thriving orchard.
You now have a cash cow where you can run your own farm and sell apples from what started with ONE tiny seed.
That’s compounding.
When you compound your gains, your money doesn’t just grow in a straight line.
It grows exponentially.
Exponential growth is what happens when your returns generate returns of their own, like an engine that powers itself.
Here’s how compounding can help your investments flourish.
Exponential Growth: Turning Small Gains into Big Wins
The beauty of compounding is in its snowball effect.
At first, the growth might seem slow, even insignificant.
But give it one year, two years or even three years.
Those small gains build on each other, multiplying your wealth faster than you’d imagine.
Consider this: If you start with an initial investment of R10,000 and achieve a 10% return per year.
With simple interest at a 10% return per year over 10 years, your initial investment of R10,000 would grow to R20,000.
Simple interest grows linearly, so it doesn’t compound like exponential growth.
Not great right!
Power of compounding – Key to escalated growth
But what if you traded the markets and achieved a stable growth rate of 36% per year (with winners and losses of course?
If you start with an initial investment of R10,000 and achieve an average return of 36% per year over 10 years, the growth will indeed be exponential due to compound interest.
Using the compound interest formula: I’ll work this out for you.
After 10 years, with an average return of 36% per year, your initial investment of R10,000 would grow to approximately R216,466. And imagine you used the power of compounding to trade and buy Bitcoin? Now we’re talkign right?
This substantial growth shows the power of compounding with high annual returns!
Notice how the growth rate accelerates as time goes on—that’s exponential growth in action.
In trading, compounding isn’t just about reinvesting your gains; it’s about consistently applying your winning strategy and letting them accumulate over time.
Here are a few practical ways to apply this:
Reinvest profits: Instead of pulling out earnings, reinvest them into your trades.
Automate your trades:
Set up a disciplined approach to reinvest gains so your portfolio compounds naturally.
Optimize position sizing:
Allocate your gains to increase your position sizes gradually, giving you higher profit potential.
Buffer against the inflation killer
When you reinvest your returns, you’re essentially building a buffer against inflation.
Each year, your money compounds and ideally outpaces the rate of inflation, preserving—and even growing—your purchasing power.
Financial Security: Building a Safety Net That Lasts
Beyond growth and inflation protection, compounding can provide you with something even more valuable—financial security.
Over time, compounding creates a stable foundation, a cushion that can support you during market volatility, retirement, or emergencies.
Here’s how to leverage compounding for long-term security
Set clear goals:
Decide what you’re compounding for—whether it’s retirement, an emergency fund, or a specific financial goal.
Stick to a disciplined plan:
Avoid the temptation to withdraw too many gains early.
Let your investments grow undisturbed.
Diversify smartly:
Compounding works best when spread across different assets, reducing risk while maximizing returns.
Think of compounding as a financial snowball that gets bigger and more powerful with every reinvested gain.
Compounding isn’t magic; it’s math, powered by consistency.
When you add discipline and a long-term view, it’s like pouring fuel on a fire. The flames of your wealth-building potential can grow brighter, warmer, and unstoppable.
So, how do you get started?
Start small, reinvest regularly, and don’t pull out your gains just because you see a profit.
Let compounding do the heavy lifting.
Because over time, those tiny reinvestments add up in a way that can completely transform your portfolio and grow your forever income orchard of apples.
How you like dem apples?
When Alt Season. Is it even happening ever again?This will be very short. Forget Alts season, it's not happening again here is why. No Lambo.
Social media Crypto gurus calling and hypes random coins every day. People are still hoping their precious alt coin will pump and make them a fortune. this is how looks all influencers accounts.
They are Calling Alt seasons every day since 2023. Did they even held some BTC ?
Back in the days in the bull run you could buy any Alt, next day it was 30% up than 100% and 300% and more in few weeks. You could literally buy anything and it went up.
But these times are gone. Game has changed and played changed.
📌 Number of coins
2017: ~1,300 coins → altseason
2021: ~9,800 coins → altseason
2025: 25,000+ coins + thousands of memes → NO ALTSEASON, only isolated pumps
When there are 25x more coins than in 2017, the same amount of liquidity gets diluted.
Altseason today = micro-seasons inside specific narratives, not a giant synchronized run.
Which is difficult to predict and you will not make it just by making technical analysis, you must pick the right one in the sea of coins. It's literally like buying a lottery ticket.
📌 The players has changed
Altseason used to be simple: money flowed into Bitcoin → profits rotated into large caps → then mid caps → then low caps → and everything exploded together. That era is gone.
📌 No more big money Rotations
Bitcoin buyers are now institutional- Blackrock , Fidelity, Vanguard and other ETFs...
Their clients are not here to sell at some point to rotate to some other Sh...coin.
Saylor is not gonna rotate in to some Sh...coins.
Yes, many people will run this playbook and influencers calling for this even every day since 2023. While it was one bitcoin show. Nothing else. Some promises of the future technology, new financial systems, faster than BTC... Its all BS...It's all small money spread to the sea of thousands and thousands of new coins created daily on Solana. It will not be enough to create such a parabolic moves as Alt season used to be.
📌 Individual pumps
It will be some individual coins pumping out of nowhere which you dont have a chance to predict Like ZEC recently. Of course some of you could argue that you been in this trade. I congratulate you if you did. But you will nor repeat this consistently on next 10 coins and most of people didn't catch this rather they did FOMO buy on the top and they are now 60% down, their investment will not turn in to hope and pray, While this was clean pump and dump and it will slowly die.
📌 Whats gonna happen next?
Lets have a look to the history top 10 coins in 2017. As you can see most of coins are not here anymore or they are simply not performing. They been just used for pump and dump and then slowly died. This is how most of the coins will end. and we can see it already here.Most coins never went above 2021 highs. Imagine holding Cardano
It has never seen ATH since 2021. Whats the chances it will pump when there is new better coins narratives again? This is basically how all alt coins looks like and they will end like most of them in 2017.
📌 Are we in bear markets?
is the BTC top in ? I think so and we will might see 45K as I predicted if you are in the alts is bad news for you, they will go much deeper and most of them will never recover after this shock. If you are Bitcoiner this is godsend. You can accumulate more sats. Because at some point BTC will see a new ATH again and again.
📌 Purpose of the Alts
VC are creating the coins, keeping the 70% of the supply. Makes a story around the coin launch it, advertise via big X influencers to pump by naive investors and then they are dumping it to them. It still repeats over and over.
Dont play this game anymore. New alts, narratives comes every-time, they come and disappear. I got you , your plan is to buy BTC, but first you want to make more money on Alts or meme so you got more BTC , but NO it's not gonna happen. You will only loose money and have less BTC in the end.
Wouldn't you be doing better if you just buying BTC and hold?
I wish you all success in the Crypto investing.
David Perk

Semiconductors Maintain a Healthy Lead Over the S&P500 (SMH/SPY)Semiconductors continue to show a healthy, steady lead over the S&P 500 on the higher-timeframe ratio chart.
• RSI uptick confirms renewed momentum
• Volume expansion supports the trend
• ATR declining signals controlled volatility and a stable advance
This structure shows a strong long-term leadership trend.
When SMH outperforms SPY on the higher timeframes, it often signals broad risk-on behavior and sustained strength in growth-driven areas of the market.

FireHoseReel | Aster DEEP ReSearch: EP5 - Inside ASTER Economy🔥 Welcome To FireHoseReel !
Let's dive into Aster Deep ReSearch EP 5 - Inside the ASTER Token Economy
🪙 Token Launch & Hype
In September 2025, ASTER officially launched and instantly grabbed headlines. Within just days, its price surged over +2000%, reaching nearly $1.90, pushing Aster’s market cap beyond $3 billion. This explosive move was fueled by a powerful combo of marketing hype, backing from CZ, and a uniquely structured community rewards model.
🎁 Aster allocated over 50% of total supply to airdrops, liquidity incentives, and referrals — creating one of the widest token distributions in DeFi. Just 24 hours after launch, more than 330K new wallets were activated on the platform.
🧬 ASTER Token Utility – Not Just Governance
ASTER isn't just a passive governance token. Its utility spans multiple layers across the Aster ecosystem:
🗳 Governance: Token holders can vote on key protocol decisions and platform upgrades.
💸 Fee Discounts & Premium Access (future): Holding ASTER may unlock lower trading fees or access to Pro features, similar to Binance’s BNB model.
🎯 Liquidity Incentives: ASTER powers LP rewards, referral programs, and ecosystem growth incentives.
💰 Staking & Margin Collateral: Users can stake ASTER to earn ~5–7% APY and simultaneously use up to 80% of staked value as margin in Aster Pro.
🔥 Aster also introduced a token-burning mechanism (approx. 5–7% annually) to control inflation and support long-term price stability.
⚠️ Challenges Ahead
While the generous airdrop strategy helped bootstrap adoption, it also introduces inflation risk and potential sell pressure if demand doesn't scale.
Aster’s long-term success depends on deep integration of ASTER within trading, governance, and infrastructure — especially as it rolls out its own Layer-1 chain (Aster Chain) with native utilities tied to the token.

Consistency: The Real Market Hack!Every trader wants consistency.
But very few understand what consistency actually means.
Consistency is not:
❌ winning every trade
❌ predicting the market
❌ avoiding losses
❌ being perfect
Consistency is built long before you press the buy (or sell) button.
Here’s what consistent traders all have in common:
1️⃣ They Repeat the Same Process Every Day!
Consistency comes from repetition; not randomness.
The best traders don’t have a different plan for every chart.
They use the same routine, the same checklist, the same rules.
Clarity replaces guesswork.
2️⃣ They Trade Only When Their System Shows Up!
Consistency is not about taking more trades.
It’s about taking only the trades that match your edge.
No signal = no trade.
No confluence = no risk.
No clarity = no entry.
Most inconsistency comes from forcing trades that never belonged in the plan.
3️⃣ They Accept Losses Without Breaking Structure!
A consistent trader still loses, they just don’t fall apart when it happens.
❌They don’t double their risk.
❌ They don’t chase entries.
❌ They don’t change strategy mid-trade.
They take the loss the same way they take the win:
within the system.
4️⃣ They Focus on Long-Term Data, Not Single Trades!
You can’t judge a strategy by one day, one week, or even one month.
Consistency is measured across:
✔ dozens of trades
✔ multiple cycles
✔ all market conditions
Professionals think in probabilities.
Beginners think in outcomes.
The Real Secret?
Consistency is not an ability.
It’s a decision you make every day:
➡️ Follow your rules
➡️ Manage your risk
➡️ Trade your edge
➡️ Ignore the noise
When your habits become consistent, your results eventually follow.
⚠️ Disclaimer: This is not financial advice. Always do your own research and manage risk properly.
📚 Stick to your trading plan regarding entries, risk, and management.
Good luck! 🍀
All Strategies Are Good; If Managed Properly!
~Richard Nasr

Understanding the Midpoint Magnet: Weekly Price Filling The concept of 50% price filling on a weekly candle within a consolidation area relates to the common technical analysis practice of looking for a midpoint retracement before a potential breakout. When an asset's price enters a consolidation phase on the weekly chart—meaning it's trading sideways within a defined high and low (often forming patterns like rectangles or triangles)—traders view the 50% level of that range (the distance from the high to the low) as a key point of equilibrium or balance between buyers and sellers. This level, which is a psychological point often included in the Fibonacci retracement tool despite not being a true Fibonacci ratio, can act as a magnet where price action is likely to 'fill' or return to before initiating the next major move. Therefore, a weekly candle's wick or body penetrating and reversing at this 50% level suggests a rebalancing of orders and offers a high-probability zone for traders to anticipate either a continuation of the prior trend or a strong breakout from the consolidation range.
Consolidation area
Identifying Consolidation and Key Levels
Consolidation Area: The broader charts show the price of Gold Spot (XAUUSD) entering a period of sideways trading, characterized by alternating weekly bullish (green) and bearish (red) candles, often within a defined high and low range. This area represents a balance or indecision between supply and demand.
Key Candle/Range: The concept then focuses on a specific high-momentum candle (e.g., the Nov 2nd Week Candle) or the entire range of the consolidation to establish the boundaries for the analysis.
The 50% Level: The critical level is the 50% retracement (or midpoint) of this chosen range. This level is considered the Equilibrium (EQ) point, where buyers and sellers are perfectly balanced.
Example
On this chart, we see:
Each weekly candle dipped into the midpoint of the one before it,
Created reaction,
And built a foundation for continuation.
As long as the market keeps holding above the 50% zone, the structure remains intact and biased toward continuation.
During consolidation phases, the market often displays a repetitive behaviour:
each weekly candle tends to retrace and fill approximately 50% of the previous week’s candle before continuing in either direction.
This happens because the midpoint of a strong weekly candle is a fair value zone, where:
liquidity is gathered,
trapped orders are resolved,
and the market achieves balance before the next move.
How the Chart Demonstrates This
November 2nd week candle
A large bullish candle created a strong move upward.
This left an imbalance in price.
The midpoint of this candle sits around 4,122.
Following weeks
Price entered consolidation.
Each weekly candle retraced into the 50% zone of the previous week’s candle.
When price reached the midpoint, buyers stepped in again, causing a bounce.
Repeat Structure
This pattern repeated across the next candles:
wick down → fill midpoint → rejection → continuation
Showing a rhythmic behaviour characteristic of consolidation:
Slow pullback
Midpoint fill
Reaction
Next candle repeats
Current Candle
Again moved back into the midpoint zone, confirming the same behaviour.
Holding above the 50% level maintains a bullish continuation structure.
Why This Happens
The 50% zone of a strong candle is often where:
-institutions reload
-pending orders sit
-imbalances are corrected
This zone is neither expensive nor cheap — it’s fair value.
So, during sideways phases, price frequently returns there to:
✔ collect liquidity
✔ balance the market
✔ establish support or resistance
Before the next directional move occurs.
Key Takeaway
In consolidation, the market does not trend strongly.
Instead, it oscillates around the previous candle’s midpoint.

Indices in the Global MarketWhat Is a Market Index?
A market index is a statistical measure that represents the value of a group of stocks. These stocks are chosen based on specific criteria such as industry, market capitalization, liquidity, or sectoral allocation. The purpose of an index is to track the performance of a market segment over time.
Indices provide:
A benchmark for investors to compare their portfolios.
A snapshot of market conditions.
A tool for passive investing through index funds and ETFs.
A reference point for derivative products like index futures and options.
Global indices summarize the performance of economies worldwide, making them vital for understanding international trends.
Types of Global Market Indices
Global indices can be categorized based on their scope and underlying composition. Here are the major types:
**1. Country-Specific Indices
These indices track the performance of a particular country’s stock market.
Examples:
United States:
S&P 500
Dow Jones Industrial Average (DJIA)
Nasdaq Composite
India:
Nifty 50
Sensex 30
Japan:
Nikkei 225
TOPIX
China:
Shanghai Composite
Hang Seng (Hong Kong market)
These indices reflect the economic condition of the respective nation, investor confidence, and market trends.
**2. Regional Indices
These track the combined markets of specific geographic regions.
Examples:
STOXX Europe 600 — represents Europe
FTSE Europe Index — major companies across Europe
S&P Asia 50 — top companies across Asian countries
Latin America 40 (LATAM 40) — top Latin American stocks
Regional indices help investors understand broader continental trends rather than country-level movements.
**3. Global Indices
These reflect the performance of companies worldwide.
Examples:
MSCI World Index — covers developed countries globally
MSCI Emerging Markets Index — tracks emerging economies
FTSE All-World Index — combines developed + emerging markets
Global indices are useful for gauging the health of the worldwide equity market.
**4. Sector-Specific Indices
These track particular industries such as technology, finance, energy, or healthcare.
Examples:
NASDAQ-100 Technology Index — tech-oriented companies
S&P Global Clean Energy Index
MSCI Global Financials Index
These help investors diversify or focus on high-growth sectors.
5. Weighted Indices (Price-Weighted, Market Cap-Weighted, Equal-Weighted)
Most global indices use one of the following methods:
Market Cap Weighted
Larger companies have more influence.
Examples: S&P 500, MSCI World.
Price Weighted
Stocks with higher prices have more influence.
Example: Dow Jones Industrial Average.
Equal Weighted
All stocks contribute equally regardless of size.
Why Global Indices Matter
Indices are more than just numbers—they drive major financial decisions.
1. Indicators of Economic Health
Indices reflect how well sectors or economies are performing.
A rising index generally signals economic expansion, while a falling one indicates slowdown.
For example:
When the S&P 500 rises consistently, it often signals strong U.S. corporate earnings.
When the Nikkei 225 falls sharply, it may indicate issues in Japan's industrial or export sectors.
2. Benchmarks for Portfolio Performance
Investors compare their returns to indices:
If a portfolio grows 10% while the S&P 500 grows 15%, the portfolio underperformed.
Fund managers aim to outperform benchmarks.
3. Underlie Passive Investment Products
Indices form the foundation for:
Index mutual funds
ETFs
Index futures
Index options
This allows investors to gain exposure to entire markets with ease.
4. Tools for Global Diversification
Investors use indices to diversify across:
Countries
Regions
Sectors
Market capitalizations
For example, someone in India can invest in global indices like Nasdaq 100 to gain exposure to U.S. technology giants.
Major Global Market Indices Explained
Below are some of the most influential indices across the world:
1. S&P 500 (USA)
Tracks the top 500 publicly traded U.S. companies.
Considered the most accurate representation of the U.S. economy.
Covers about 80% of U.S. market capitalization.
2. Dow Jones Industrial Average (USA)
Oldest U.S. index.
Tracks 30 large blue-chip companies.
Price-weighted.
3. Nasdaq Composite (USA)
Tech-heavy.
Includes over 3,000 stocks.
Reflects innovation and growth sectors.
4. Nikkei 225 (Japan)
Price-weighted index of 225 major Japanese companies.
Represents Asia’s most influential market.
5. FTSE 100 (UK)
Top 100 companies listed on the London Stock Exchange.
A key benchmark for the UK economy.
6. DAX 40 (Germany)
Tracks Germany's top 40 blue-chip companies.
Represents the powerhouse of the European Union.
7. Hang Seng (Hong Kong)
Represents Hong Kong’s free-market financial hub.
Strong exposure to Chinese companies.
8. Shanghai Composite (China)
Includes all stocks listed on Shanghai Stock Exchange.
Represents China’s domestic economic health.
9. Nifty 50 & Sensex (India)
Nifty 50: Top 50 companies by market cap.
Sensex: 30 large companies.
Both reflect India’s fast-growing economy.
How Global Indices Influence Each Other
In today’s interconnected economy, movements in one major index affect others.
Example:
If U.S. indices crash, Asian and European markets often fall the next day.
When China reports weak economic data, indices like Hang Seng, Nikkei, and even DAX may decline.
Global indices move in a chain reaction due to:
Trade relations
Currency fluctuations
Global risk sentiment
Monetary policy decisions
Indices as Tools for Traders
Global indices are widely used for:
1. Technical Analysis
Price trends, support/resistance levels, and chart patterns influence trading decisions.
2. Futures and Options Trading
Indices like Nifty, Dow, and Nasdaq have liquid derivative markets.
3. Hedging
Investors hedge their equity portfolios using index derivatives.
Conclusion
Global market indices are essential components of the financial ecosystem. They summarize economic performance, guide investment strategies, influence global capital flow, and provide transparent benchmarks for evaluating market trends. Understanding these indices gives traders and investors the ability to make informed decisions, diversify globally, and interpret the broader financial landscape. Whether you follow the S&P 500, Nikkei 225, FTSE 100, or Nifty 50, each index tells a story about its economy, sector, and global interconnectedness—making indices indispensable tools for navigating the world of finance.

Global Recession Impact on the Stock Market1. Decline in Corporate Earnings and Profit Margins
A recession directly reduces business activity. Companies face:
Lower consumer spending
Weak industrial output
Supply-chain disruptions
Reduced global trade
All these factors hurt corporate profits. Since stock prices are fundamentally based on future earnings, declining earnings expectations lead to falling stock valuations. Sectors dependent on discretionary spending—such as automobiles, luxury goods, travel, entertainment, and retail—tend to see the largest drops.
Industries like utilities, consumer staples, and healthcare experience comparatively less damage because demand remains steady even in downturns.
2. Sharp Stock Market Sell-Offs and Panic Reactions
Recessions amplify fear and uncertainty, triggering:
Panic selling
Liquidity crunches
Forced margin call selling
Flight to safety (bonds, gold, cash)
Investors prefer safe assets over risky equities. This results in broad market declines, often leading to bear markets—defined as a 20% or more drop in stock indices.
Historical patterns show:
2008 Global Financial Crisis: Markets fell 50–60%
2000 Dot-com Crash: Tech-heavy indices declined massively
2020 COVID Crash: Markets dropped 30% in weeks due to recession fears
Psychology plays a huge role. When investors anticipate economic pain, they exit the market rapidly, causing steep downward moves.
3. Rising Volatility and Unpredictable Market Behaviour
During a recession, stock markets experience extreme volatility. Indices can swing 3–8% in a single day as investors react to:
Policy announcements
Interest rate changes
Earnings warnings
Employment reports
Global news and geopolitical events
The VIX index, known as the “fear index”, typically shoots upward in recession periods, reflecting a sharp rise in market uncertainty.
4. Credit Tightening and High Borrowing Costs
Recessions often lead banks and financial institutions to become risk-averse. This causes:
Reduced lending activity
Higher interest rates for risky borrowers
Difficulty for companies to raise capital
Delayed expansion or investment projects
As finance becomes difficult to access, companies struggle to maintain operations, leading to declining stock prices. Financial sector stocks are heavily affected because loan defaults and credit stress increase during recessions.
5. Job Losses and Lower Consumer Spending Hit Market Sentiment
When unemployment rises, consumers reduce spending. This creates a chain reaction:
Lower sales → lower profits → lower stock prices
Businesses cut costs → more layoffs → weaker economy
Investor sentiment drops further
The stock market is extremely sensitive to consumer confidence. When the global population reduces spending, markets price in weaker future demand, causing indices to fall.
6. Currency Fluctuations and Emerging Market Instability
During global recessions:
Investors move money to safe-haven currencies like USD or CHF
Emerging market currencies weaken
Foreign investors withdraw capital
This capital outflow leads to:
Stock market declines in developing countries
Higher import costs
Interest rate hikes to stabilize currency
These factors further intensify stock market stress in regions dependent on foreign investment.
7. Commodity Price Crashes Hit Commodity-Based Markets
Demand for commodities—oil, metals, energy—drops sharply during recessions. This leads to:
Falling commodity prices
Significant declines in commodity-driven equity markets
Lower revenues for countries and companies dependent on raw materials
Energy and mining stocks especially suffer during global downturns.
8. The Role of Central Banks and Government Interventions
While recessions hurt markets, governments and central banks attempt to stabilize conditions using:
Interest rate cuts
Quantitative easing
Fiscal stimulus packages
Bank bailouts or liquidity injections
Such actions can provide temporary relief and may cause short-term market rallies, even during recessions. However, long-term recovery depends on the real economy improving.
Markets often respond positively to stimulus, but if the recession is deep, the rallies may be short-lived.
9. Shift from Growth Stocks to Value and Defensive Stocks
During recessions, investor preferences shift:
Growth Stocks (Tech, Startups, High-Risk Sectors)
Decline more sharply due to high valuations
Struggle with funding shortages
Reduced investor appetite for risk
Value and Defensive Stocks (FMCG, Utilities, Healthcare)
Hold value better
Provide dividends
Offer stability
Portfolio rotation becomes a major trend during recessions, influencing market behavior across sectors.
10. Long-Term Opportunities for Investors
While recessions cause fear and losses, they also create the best long-term investment opportunities. Historically:
Markets recover and hit new all-time highs after recessions
Quality stocks become undervalued
Long-term investors gain the most during recovery phases
Key benefits for disciplined investors include:
Lower entry prices
Higher future returns
Stronger long-term compounding
However, identifying fundamentally sound companies is crucial.
11. Slow and Uneven Recovery Across Sectors
Even after recession ends:
Some sectors recover quickly (technology, IT services, pharma)
Others take years (travel, real estate, heavy industries)
The recovery of stock markets does not always align with economic recovery. Markets often recover before the economy because they are forward-looking.
Conclusion
A global recession deeply affects stock markets through falling corporate earnings, reduced spending, rising job losses, tightening credit, and panic selling. Market volatility increases dramatically, and global liquidity dries up. Sectors linked to discretionary spending and commodities face the sharpest declines, while defensive sectors remain comparatively stable.
Although recessions cause fear and uncertainty, they also offer long-term buying opportunities. Markets eventually recover and grow beyond previous highs, rewarding patient, disciplined investors with strong returns.
Understanding these dynamics helps traders and investors navigate turbulent times with clarity, strategy, and confidence.

Inflation and Interest Rates in the Global Market1. Understanding Inflation in the Global Economy
What is Inflation?
Inflation refers to the sustained increase in the general price level of goods and services in an economy. When inflation rises, the purchasing power of money declines—meaning the same amount of money buys fewer goods.
Inflation is typically classified into several types:
Demand-pull inflation: Occurs when demand for goods and services exceeds supply.
Cost-push inflation: Happens when production costs rise (e.g., higher wages, raw materials), forcing companies to increase prices.
Built-in inflation: Caused by a cycle of rising wages and prices driven by expectations.
Imported inflation: Arises when global commodity prices, especially oil and food, rise and countries import more expensive goods.
Global Factors Driving Inflation
In today’s globalized world, inflation isn’t limited to domestic conditions. It can escalate due to:
Energy price fluctuations
Oil and gas prices significantly impact inflation. When energy becomes expensive, transportation and manufacturing costs rise worldwide.
Supply chain disruptions
Events like pandemics, geopolitical tensions, and port congestions reduce supply, raising global prices.
Currency depreciation
When a nation’s currency weakens, imports become costlier, increasing domestic inflation.
Geopolitical conflicts
Wars or sanctions impact commodities like oil, wheat, and metals, triggering inflation globally.
Monetary easing
Excessive money supply from prolonged low interest rates can push global inflation higher.
Thus, inflation is no longer just a local phenomenon—it is deeply tied to global economic dynamics.
2. Role of Central Banks in Controlling Inflation
Central banks like the Federal Reserve (US), European Central Bank (ECB), Bank of England, and Reserve Bank of India manage inflation primarily through monetary policy, which includes adjusting interest rates and controlling money supply.
Tools Central Banks Use
Policy interest rates
The main tool. Raising rates cools inflation; lowering rates stimulates growth.
Open market operations
Buying or selling government securities to manage liquidity.
Reserve requirements
Setting how much banks must hold as reserves.
Forward guidance
Communicating future policy direction to stabilize markets.
Central banks aim to maintain inflation near a target, often around 2%, which supports stable economic growth.
3. Interest Rates and Their Global Implications
What are Interest Rates?
Interest rates represent the cost of borrowing money. When central banks increase rates, loans become more expensive and savings more attractive. When they decrease rates, borrowing becomes cheaper, stimulating spending and investment.
Why Interest Rates Matter Globally
Interest rate decisions by major central banks, especially the US Federal Reserve, influence global capital flows. Higher rates in one country attract foreign investors looking for better returns, strengthening that country’s currency and affecting financial markets worldwide.
Global Effects of Rate Hikes
Stronger currency in the rate-hiking country
This makes imports cheaper but exports more expensive.
Capital outflows from emerging markets
Investors pull out money to invest in safer, higher-yield markets.
Higher borrowing costs
Countries with high external debt suffer when global interest rates rise.
Drop in global stock markets
Investors shift from stocks to bonds when interest rates rise.
Global Effects of Rate Cuts
Weaker currency
Supporting exports but making imports costlier.
Increase in global liquidity
Encourages investment in emerging markets and riskier assets.
Stock market rally
Lower borrowing costs stimulate corporate profits and valuations.
4. The Inflation–Interest Rate Relationship
Inflation and interest rates have a direct but inverse relationship:
When inflation rises, central banks raise interest rates to cool the economy.
When inflation falls, central banks lower rates to encourage borrowing and spending.
How Higher Rates Reduce Inflation
Reduced consumer spending
Loans become expensive; people delay home, car, and personal purchases.
Lower business investment
High borrowing costs discourage expansion.
Decreased money supply
Slows down economic flow of money.
Strengthened currency
Reduces import costs, lowering overall inflation.
How Lower Rates Increase Inflation
Boosted borrowing and spending
Increased business investment
Weaker currency makes exports competitive
Economic growth accelerates
Central banks must carefully balance controlling inflation without pushing economies into recession.
5. Impact on Global Financial Markets
1. Stock Markets
High inflation and interest rates usually lead to falling stock prices because:
Corporate profits shrink due to higher costs.
Consumers spend less.
High rates reduce the present value of future earnings.
Conversely, low rates often trigger stock market rallies.
2. Bond Markets
Bonds are extremely sensitive to interest rates.
Rates up → Bond prices down
Rates down → Bond prices up
Global investors closely watch central bank decisions to adjust bond portfolios.
3. Currency Markets (Forex)
Interest rates drive forex movements.
High rates → currency strengthens.
Low rates → currency weakens.
Countries with hyperinflation experience rapid currency depreciation.
4. Commodity Markets
Inflation pushes commodity prices higher, especially gold, which is considered a hedge. Rising interest rates, however, often reduce demand for commodities by slowing the global economy.
6. Global Trade and Economic Growth
Inflation and interest rate changes significantly impact world trade:
High inflation weakens export competitiveness
High interest rates reduce global demand
Lower interest rates stimulate trade and cross-border investments
Differences in inflation and interest rates across nations also create arbitrage opportunities, influencing the flow of goods, capital, and currencies.
7. Challenges for Emerging Markets
Developing nations face greater risks from global inflation and interest rate changes. Issues include:
Debt crises due to higher repayment costs.
Capital flight when investors move to safer markets.
Currency depreciation causing imported inflation.
Pressure on central banks to increase rates even if local economic conditions are weak.
8. The Road Ahead: A Changing Global Landscape
As global uncertainties—such as geopolitical tensions, technological disruptions, and climate-driven supply shocks—continue, inflation is becoming more volatile. This forces central banks to adopt more dynamic and data-driven policies. The future global market will be defined by:
Rapid policy adjustments
Digital currencies influencing inflation and money supply
Greater coordination among nations
A stronger focus on supply chain diversification
Conclusion
Inflation and interest rates are core pillars of the global economic system. Inflation affects everything—from household budgets to multinational strategies—while interest rates determine the cost of money worldwide. The balance between these forces dictates growth, stability, and investment flows in the global market. As economies become more interconnected, local inflation or rate changes can instantly impact the entire world. Mastering this relationship helps investors, policymakers, and businesses navigate an increasingly complex global economy with clarity and confidence.

Trading with Global Assets1. What Are Global Assets?
Global assets are financial instruments available for trading on international markets. These include:
1. Global Stocks
Shares of companies listed on foreign exchanges such as:
NASDAQ, NYSE (USA)
LSE (UK)
TSE (Japan)
HKEX (Hong Kong)
Euronext (Europe)
Through global trading platforms or depository receipts (ADR/GDR), investors can gain exposure to multinational companies like:
Apple
Tesla
Alibaba
Toyota
Nestlé
2. Forex (Global Currencies)
Forex is the world’s largest financial market, operating 24×5. Traders deal in currency pairs such as:
EUR/USD
USD/JPY
GBP/USD
AUD/CAD
These pairs reflect economic health, interest rates, and geopolitical conditions.
3. Global Commodities
Commodities come from exchanges like:
CME (Chicago)
ICE (London/New York)
MCX (India)
Important commodities include:
Gold, Silver, Platinum
Crude Oil, Natural Gas
Corn, Wheat, Coffee
4. Global Indices
Indices represent the performance of groups of stocks:
S&P 500
Dow Jones
FTSE 100
Nikkei 225
DAX 40
Trading indices is a way to participate in the broad movement of an entire economy or sector.
5. Bonds and Global Debt Markets
Governments and corporations issue bonds internationally. Examples:
US Treasury Bonds
German Bunds
Japanese Government Bonds (JGBs)
Global bond trading provides stability and diversification.
6. Cryptocurrencies
Digital assets like:
Bitcoin
Ethereum
Solana
are traded globally 24/7. Their decentralized nature makes them attractive but highly volatile.
2. Why Trade Global Assets?
1. Diversification
Instead of relying only on your home country’s market, global assets spread risk across:
regions
currencies
industries
economic cycles
If one country faces recession, others may still perform well.
2. Access to High-Growth Markets
For example:
Investing in US tech stocks
Trading China’s manufacturing giants
Buying Middle Eastern energy companies
Exposure to international sectors gives traders more opportunities.
3. Around-the-Clock Trading
Trading global assets means:
Forex: 24 hours
Crypto: 24/7
Stocks: Based on time zones (US, Europe, Asia)
You can trade almost any time of day depending on which market is open.
4. Profit from Currency Movements
If your local currency depreciates, foreign assets may become more valuable, helping preserve wealth.
5. Hedging Strategies
Businesses and traders use global assets to hedge risks such as:
Currency risk
Interest-rate changes
Commodity price fluctuations
3. How to Trade Global Assets
Step 1: Choose a Global Trading Platform
Platforms offering global access include:
Interactive Brokers
Saxo Bank
TD Ameritrade
eToro
Binance (for crypto)
These platforms provide multi-asset access with global market data.
Step 2: Understand Market Hours
Every region has different trading sessions:
Asian Session (Tokyo, Shanghai)
European Session (London, Frankfurt)
US Session (New York)
Traders often use overlapping sessions (e.g., London–New York) because liquidity is highest.
Step 3: Study the Global Economy
Factors that affect global assets:
Interest rate announcements
Central bank policies
Inflation data
GDP reports
Geopolitical tensions
Oil supply decisions (OPEC)
Successful global traders follow global news daily.
Step 4: Use Proper Risk Management
Essential techniques:
Stop-loss orders
Position sizing
Diversification
Hedging using derivatives
Risk management is crucial because global assets can be highly unpredictable.
Step 5: Learn Technical and Fundamental Analysis
Global traders use:
Charts and indicators (technical)
Economic data, earnings reports, global events (fundamental)
Blending both improves the accuracy of trade decisions.
4. Opportunities in Global Asset Trading
1. Emerging Markets
Countries like India, Brazil, Vietnam, and Indonesia offer rapid growth. Traders often buy ETFs or stocks representing these markets.
2. Tech Innovation
US markets lead in:
AI
Biotechnology
Semiconductor manufacturing
Cloud computing
These sectors can deliver high returns.
3. Commodity Supercycles
When global demand rises (e.g., infrastructure projects), commodities like copper and crude oil surge.
4. Global Currency Trends
Currencies are affected by:
War
Interest rate hikes
Policy changes by central banks
These create trading opportunities for forex traders.
5. Energy Transition
Green energy assets like:
Lithium
Solar panel manufacturers
Hydrogen stocks
are rising due to global sustainability goals.
5. Risks in Global Asset Trading
1. Currency Risk
When your currency strengthens, foreign investments may lose value.
2. Geopolitical Risk
Examples include:
war
sanctions
border conflicts
political instability
These events can cause sudden market volatility.
3. Liquidity Risk
Not all global assets trade with high volume. Low liquidity can lead to:
wide spreads
slippage
difficulty exiting trades
4. Market Timing Issues
Time zone differences can make it challenging to react quickly to market events.
5. Economic Risk
Different countries react differently to:
inflation
interest rates
unemployment
recession
Unexpected policy changes impact asset prices significantly.
6. Strategies for Successful Global Asset Trading
1. Trend Following
Identify long-term global macro trends like:
interest rate cycles
dollar strength/weakness
commodity price trends
Ride the trend with appropriate assets.
2. Pair Trading
Trade correlated pairs such as:
Brent Crude vs WTI Crude
EUR/USD vs GBP/USD
NASDAQ vs S&P 500
This helps hedge risk.
3. Sector Rotation
Move investments between leading global sectors based on economic cycles:
Expansion → Tech & Industrials
Recession → Healthcare & Utilities
4. Carry Trades (Forex)
Borrow money in low-interest-rate currencies and invest in high-interest currencies to earn yield differentials.
5. Multi-Asset Portfolios
Balance your global trades across:
stocks
commodities
forex
bonds
crypto
This reduces portfolio volatility.
Conclusion
Trading with global assets provides unmatched access to world markets, allowing traders to benefit from trends, innovations, and growth opportunities beyond their home country. It offers diversification, 24-hour trading, exposure to global economic cycles, and the chance to profit from movements in currencies, commodities, and international stocks. However, it also introduces risks such as currency fluctuations, geopolitical uncertainties, market timing challenges, and liquidity issues.
Success in global asset trading depends on learning market behavior, following global financial news, using disciplined risk management, and applying effective trading strategies. For individuals who understand the global economy and are prepared to manage volatility, trading global assets can be both profitable and rewarding.
Role of International Trade1. Driving Economic Growth and Development
One of the primary roles of international trade is to accelerate economic growth. When countries engage in cross-border trade:
GDP increases due to higher production and export activities.
Foreign exchange earnings expand, allowing countries to import advanced goods and technologies.
Investment flows rise, as global investors look for new markets and opportunities.
Developing nations particularly benefit from increased exports of agricultural products, textiles, minerals, or manufactured goods. When these countries participate in global markets, they experience:
Higher income levels
Improved infrastructure
Better economic stability
Integration with global supply chains
Historically, trade-led growth has transformed economies like China, South Korea, and Singapore, demonstrating that global integration is a powerful engine for development.
2. Promoting Specialization and Comparative Advantage
International trade allows countries to specialize, producing goods and services they can create most efficiently. This concept is rooted in the theory of comparative advantage, proposed by economist David Ricardo.
For example:
India specializes in IT services, pharmaceuticals, and textiles.
Germany excels in automobile manufacturing and engineering.
Japan specializes in electronics and robotics.
Brazil is strong in agriculture and raw materials.
Specialization increases:
Productivity
Efficiency
Quality of goods
Global competitiveness
By focusing on strengths, nations produce more with fewer resources and trade for goods they cannot efficiently manufacture.
3. Expanding Markets for Businesses
Without international trade, companies are constrained by the size of their domestic markets. Trade opens access to billions of consumers worldwide, allowing firms to scale production, reduce costs, and increase profits.
Key benefits include:
Access to larger customer bases
Opportunity to diversify products
Increased brand recognition
Ability to compete globally
Export-oriented industries often grow faster than domestic-focused ones because they face greater demand and tougher competition, which boosts innovation and efficiency.
4. Generating Employment Opportunities
International trade creates millions of direct and indirect jobs across sectors such as:
Manufacturing
Agriculture
IT and services
Logistics and shipping
Banking and finance
Export industries usually require skilled and unskilled labor, increasing employment opportunities. Additionally, growth in trade-related sectors—port operations, customs, warehousing, and transportation—creates supply chain jobs.
In many developing countries, trade-driven manufacturing has pulled millions out of poverty by providing stable income and opportunities for skill development.
5. Encouraging Innovation and Technology Transfer
A key role of international trade is accelerating global technological advancement. When countries import technology-rich products such as machinery, robotics, medical devices, and software, they indirectly gain access to new knowledge and innovation.
Trade fosters:
Technology transfer, from advanced economies to developing nations
Improved industrial processes through imported machinery
Research and Development (R&D) investments driven by global competition
Multinational companies bring modern production systems, managerial skills, and digital tools to the countries where they operate. This accelerates industrialization and enhances productivity.
6. Enhancing Consumer Choice and Quality of Life
International trade dramatically increases the variety of products available to consumers. Without global trade:
Fruits like apples, kiwis, and oranges would be unavailable in many regions.
Electronics, automobiles, and smartphones would be far costlier.
Medicines and medical equipment would be limited.
Trade ensures:
Lower prices
Better product quality
Wider product variety
Continuous innovation
Competition from foreign producers forces domestic companies to improve their products and cut costs, benefiting consumers directly.
7. Strengthening Geopolitical and Diplomatic Relations
Trade is not just an economic tool but also a strategic instrument in international diplomacy. When countries engage in trade partnerships, they build political trust and cooperation.
Benefits include:
Stronger international alliances
Reduced chances of conflict due to mutual economic dependence
Increased cultural exchange
Collaborative agreements in defense, research, and environment
Institutions like the World Trade Organization (WTO), regional trade blocs (EU, ASEAN, NAFTA/USMCA), and bilateral agreements help maintain global economic stability.
8. Supporting Industrial and Infrastructural Development
International trade encourages governments to invest in:
Ports
Highways
Railways
Digital networks
Special Economic Zones (SEZs)
Warehousing and logistics facilities
These improvements not only boost export capacity but also strengthen domestic economic development. In many developing countries, international trade has driven major upgrades in transportation and communication infrastructure.
9. Reducing Production Costs through Global Supply Chains
Trade enables companies to source raw materials, components, and labor from countries where they are most cost-effective.
Examples:
Electronics manufacturers source chips from Taiwan, assembly from China, and components from Malaysia.
Automobile companies import spare parts from multiple countries.
Fashion brands source textiles from India and Bangladesh.
This interconnected global supply chain reduces production costs and enhances efficiency. It also allows companies to diversify supply sources, reducing dependence on any single country.
10. Promoting Economic Resilience and Diversification
Countries that rely heavily on a single industry or resource are vulnerable to economic shocks. International trade helps diversify economic activities.
For example:
Gulf countries are investing in tourism and manufacturing to reduce oil dependency.
African countries are moving from raw material exports to processed goods.
Asian economies balance IT services, manufacturing, and agriculture.
Diversification through trade strengthens economic resilience and reduces vulnerability to global price fluctuations.
Conclusion
International trade plays a foundational role in shaping the modern global economy. It drives economic growth, promotes specialization, increases innovation, and expands opportunities for businesses and workers alike. It enriches consumer choice, strengthens diplomatic ties, and promotes global economic stability.
For developing nations, international trade is a powerful engine for lifting populations out of poverty, modernizing industries, and integrating into global value chains. For advanced economies, it supports innovation, competitiveness, and continued prosperity.
In a rapidly globalizing world, the role of international trade is more significant than ever—linking nations, building economies, and shaping a more interconnected and prosperous global future.

Instruments of Global Trading1. Equities (Stocks)
Equities represent ownership in a company, and they are one of the most widely traded instruments globally. When investors buy shares of companies listed on exchanges such as the New York Stock Exchange (NYSE), London Stock Exchange (LSE), or Tokyo Stock Exchange (TSE), they become partial owners of those companies.
Why equities matter in global trade:
Companies use stocks to raise capital for expansion.
Investors gain exposure to global economic growth.
Equities allow diversification across countries and sectors.
Global equity markets support cross-border investment, meaning investors in India can buy shares of U.S. tech companies or European automakers through international platforms or depository receipts.
Types of equity instruments:
Common stock
Preferred shares
Global Depository Receipts (GDRs)
American Depository Receipts (ADRs)
ADRs and GDRs allow foreign companies to trade their shares in another country’s stock market, making global participation easier.
2. Bonds (Fixed-Income Instruments)
Bonds are debt instruments issued by governments, corporations, and supranational organizations (like the World Bank). Investors lend money to the issuer in return for fixed or variable interest payments.
Key global bond types:
Government bonds (U.S. Treasuries, German Bunds, Indian G-Secs)
Corporate bonds
Eurobonds (issued in a currency outside the issuer’s home country)
Foreign bonds (issued in a foreign market in that market’s currency)
Green bonds (for sustainable projects)
Why bonds are essential globally:
They provide stable returns.
They allow governments to finance infrastructure.
They help corporations expand internationally.
They enable global diversification of risk.
Global bond trading happens over-the-counter (OTC), with trillions of dollars traded daily.
3. Foreign Exchange (Forex)
The forex market is the largest and most liquid market in the world. It involves the global trading of currencies like the USD, EUR, GBP, INR, JPY, and many more.
Major FX instruments:
Spot trades: Immediate exchange of currencies.
Forwards: Agreements to exchange currency at a future date at a fixed rate.
Swaps: Simultaneous buying and selling of currency for different dates.
Currency futures & options: Exchange-traded contracts for hedging or speculation.
Why forex trading is vital:
Facilitates international trade and travel.
Helps companies hedge currency exposure.
Supports global investment flows.
Most global commodities and financial assets are priced in USD, making currency trading a key part of global markets.
4. Commodities
Commodities are physical goods traded globally, usually categorized into:
Energy Commodities
Crude oil (Brent, WTI)
Natural gas
Coal
Metals
Gold
Silver
Copper
Platinum
Agricultural Products
Wheat
Corn
Soybeans
Sugar
Coffee
Why commodities matter:
They are essential raw materials for industries.
Commodity prices influence inflation and economic stability.
Countries depend on commodity exports/imports for economic growth.
Global commodity markets operate through futures exchanges such as:
Chicago Mercantile Exchange (CME)
Intercontinental Exchange (ICE)
Multi Commodity Exchange (MCX)
5. Derivatives
Derivatives are financial contracts whose value is derived from an underlying asset (stocks, bonds, currencies, or commodities). They are used for speculation, hedging, and risk management.
Main derivative instruments:
Futures: Standardized contracts to buy or sell assets at a future date.
Options: Right, but not the obligation, to buy or sell an asset.
Swaps: Exchange of cash flows, often interest-rate based.
Forwards: Private agreements tailored between parties.
Role in global markets:
Reduce risk for corporations and banks.
Provide leverage for traders seeking higher returns.
Enhance liquidity in financial markets.
Interest rate swaps and currency derivatives are among the most heavily traded global instruments.
6. Exchange-Traded Funds (ETFs)
ETFs are funds that track indices, sectors, commodities, or bonds. They trade like stocks and provide exposure to diversified assets.
Popular global ETF categories:
Equity ETFs (e.g., S&P 500, Nasdaq)
Bond ETFs
Commodity ETFs (Gold ETFs, Oil ETFs)
Sector ETFs (Technology, Healthcare)
International Market ETFs (Japan ETF, China ETF)
ETFs allow investors worldwide to gain exposure to foreign markets without buying assets directly.
7. Mutual Funds
Mutual funds pool money from investors and invest in diversified portfolios across stocks, bonds, and global markets.
Types relevant to global trading:
International funds
Emerging market funds
Global index funds
Sectoral funds
They offer diversification and professional fund management for global exposure.
8. Money Market Instruments
Short-term, low-risk instruments used for liquidity and short-term financing.
Common money market products:
Treasury bills (T-Bills)
Commercial papers (CP)
Certificates of Deposit (CDs)
Repos and reverse repos
These instruments help manage global liquidity and interest rates.
9. Cryptocurrencies and Digital Assets
Digital assets have become major players in global trading.
Popular instruments:
Cryptocurrencies (Bitcoin, Ethereum)
Stablecoins (USDT, USDC)
Tokenized assets
Crypto futures and options
DeFi instruments
Digital assets allow borderless, 24/7 trading and provide alternative investment opportunities.
10. Trade Finance Instruments
These instruments support global import-export activities.
Key instruments:
Letters of Credit (LCs)
Bills of Exchange
Bank Guarantees
Factoring & Forfaiting
Documentary Collections
Trade finance instruments reduce payment and delivery risks between international buyers and sellers.
11. Real Estate Investment Trusts (REITs)
REITs allow global investors to participate in income-generating real estate without owning physical property.
Why they matter:
Offer stable returns and dividends.
Provide global real estate exposure.
Highly liquid compared to physical property.
Global REITs include those from the U.S., Singapore, Japan, and Europe.
Conclusion
Global trading relies on a wide and complex range of instruments—from basic equities and bonds to advanced derivatives, commodities, and digital assets. These instruments enable capital flow, support international business, facilitate investment diversification, and help manage risk on a global scale. Understanding them allows traders to make informed decisions, exploit market opportunities, and protect their portfolios in a dynamic global economy.
Types of Trading in the World Market1. Equity (Stock) Trading
Stock trading is one of the most popular forms of trading globally. Traders buy and sell shares of publicly listed companies on exchanges such as NYSE, NASDAQ, London Stock Exchange, Tokyo Stock Exchange, and NSE/BSE in India.
Types of Stock Trading
Intraday Trading:
Buying and selling within the same trading day. Traders use technical analysis, chart patterns, and indicators to exploit short-term price movements.
Swing Trading:
Positions are held for several days or weeks. Swing traders focus on medium-term trends and market cycles.
Position Trading:
Long-term trading, where traders hold stocks for months or years based on fundamentals, economic outlook, and company growth.
Momentum Trading:
Traders enter stocks showing strong upward or downward movement with high volume, aiming to profit from continued momentum.
Equity markets are influenced by earnings reports, corporate news, economic data, interest rates, and geopolitical events.
2. Forex (Foreign Exchange) Trading
The Forex market is the largest and most liquid financial market in the world, with daily turnover exceeding $7 trillion. Traders buy and sell currency pairs such as EUR/USD, GBP/JPY, USD/INR, etc.
Key Features
Market remains open 24 hours, five days a week.
Influenced by macroeconomic indicators, central bank policy, and global events.
Types of Forex Trading
Scalping:
Ultra-short-term trading where traders make dozens of trades in a day for small profits.
Day Trading:
Similar to intraday trading in stocks but applied to currency markets.
Carry Trade:
Traders borrow in low-interest currencies and invest in high-interest currencies to profit from rate differences.
Algorithmic Forex Trading:
Automated systems trade based on programmed strategies.
3. Commodity Trading
Commodities include gold, silver, crude oil, natural gas, wheat, coffee, copper, and more. These are traded on global exchanges like the Chicago Mercantile Exchange (CME), London Metal Exchange (LME), and Multi Commodity Exchange (MCX) in India.
Two Types of Commodity Trading
Spot Trading:
Immediate purchase and delivery of commodities.
Futures Trading:
Buying and selling commodity futures contracts, where traders speculate on future prices rather than owning the physical commodity.
Commodity prices are influenced by weather, supply-demand dynamics, geopolitical tensions, and macroeconomic trends.
4. Derivatives Trading
Derivatives derive their value from underlying assets like stocks, indices, commodities, interest rates, or currencies. The most common derivatives are Futures and Options.
Futures Trading
A legally binding agreement to buy or sell an asset at a predetermined price on a future date. Traders use futures for speculation and hedging.
Options Trading
Options give traders the right, but not the obligation, to buy or sell an asset at a certain price.
Two types:
Call Option – right to buy
Put Option – right to sell
Common option strategies include straddle, strangle, iron condor, and covered call.
Index Trading
Indices like S&P 500, NASDAQ 100, NIFTY 50, FTSE 100, and DAX are traded via futures and ETFs.
5. Cryptocurrency Trading
Crypto trading has become a major global phenomenon. Traders buy and sell digital currencies like Bitcoin, Ethereum, Solana, XRP, Dogecoin, and thousands of altcoins on exchanges such as Binance, Coinbase, and Kraken.
Types of Crypto Trading
Spot Crypto Trading:
Actual buying and selling of coins.
Margin Trading:
Using borrowed funds to amplify returns (high risk).
Futures and Perpetual Swaps Trading:
Popular for leveraged speculation without owning crypto.
Arbitrage Trading:
Profiting from price differences across exchanges.
Crypto markets operate 24/7 and are influenced by global sentiment, technological innovations, regulations, and market cycles.
6. Bond and Fixed-Income Trading
Bonds are debt instruments issued by governments, corporations, and municipal bodies. They are traded mostly in OTC markets.
Major Types of Bond Trading
Government bonds (U.S. Treasuries, Indian G-Secs)
Corporate bonds
Municipal bonds
High-yield bonds
Bond traders focus on interest rates, inflation data, monetary policy, and credit ratings.
7. ETF and Mutual Fund Trading
Exchange-Traded Funds (ETFs) trade like stocks but represent a basket of assets such as indices, sectors, commodities, or bonds.
ETF Trading Types
Index ETFs: Track major indexes
Sector ETFs: Technology, banks, energy
Commodity ETFs: Gold ETF, oil ETF
Leveraged ETFs: 2x or 3x exposure
Mutual fund trading is not intraday; purchase and redemption occur at day-end NAV.
8. Algorithmic & High-Frequency Trading (HFT)
Algorithmic trading uses automated computer programs to execute trades based on predefined rules. High-Frequency Trading focuses on extremely fast trades using powerful servers and low-latency connections.
Common Algo Strategies
Market making
Statistical arbitrage
Trend-following
Mean reversion
These strategies dominate global equity and forex markets.
9. Social & Copy Trading
Platforms like eToro allow traders to copy the strategies of top-performing traders. New traders benefit by following experienced professionals.
10. Dark Pool Trading
Dark pools are private exchanges where large institutional investors trade without publicly revealing their orders. This prevents price distortion caused by large trades.
11. OTC (Over-the-Counter) Trading
OTC trading happens directly between parties rather than on centralized exchanges. It is common in:
Forex
Bonds
Derivatives
Small-cap stocks
OTC trading provides flexibility but may involve higher counterparty risk.
Conclusion
The world market offers a wide spectrum of trading types, each with unique characteristics, risk levels, and opportunities. From stock and forex trading to advanced derivatives and algorithmic trading, the global financial landscape is vast and dynamic. Traders choose their preferred style based on time availability, capital, market knowledge, and psychological comfort. Understanding the various types of trading is the first step toward developing a strategy aligned with personal goals. As markets continue to evolve with technology and globalization, traders have more tools and asset classes than ever before, making the world of trading accessible and full of potential.
Global Supply Chain Shifts1. The Origins of Recent Supply Chain Disruptions
The earliest signals of major global supply chain shifts emerged long before the COVID-19 pandemic. Rising labor costs in traditional manufacturing hubs, trade wars, and technological automation were already pushing companies to rethink supply networks. However, the pandemic acted like a fast-moving catalyst, exposing deep vulnerabilities in global logistics.
Lockdowns disrupted factory operations, border restrictions created bottlenecks, and shipping delays caused shortages across industries—from electronics to pharmaceuticals. The world realized that relying too heavily on a single region (especially China) for critical manufacturing introduced significant risks. This triggered a global reassessment of supply chain strategies, prompting governments and corporations to diversify production bases.
2. Geopolitical Tensions and Regional Realignment
One of the strongest forces shaping modern supply chains is geopolitics. The U.S.–China trade war—marked by tariffs, technology restrictions, and strategic competition—pushed companies to reduce dependence on Chinese manufacturing. Terms like “decoupling” and “de-risking” became central in policy discussions.
Countries began revisiting their trade dependencies:
U.S. and European markets shifted toward building domestic production capacity in critical sectors like semiconductors, electric vehicles, and pharmaceuticals.
China, in response, focused on strengthening its internal supply chains and investing heavily in self-sufficiency.
India, Vietnam, Indonesia, and Mexico emerged as alternative manufacturing hubs, benefiting from the “China-plus-one” strategy followed by global corporations.
These geopolitical shifts are not temporary trends—they represent a long-term structural realignment in global trade patterns.
3. Reshoring, Nearshoring, and Friendshoring
As a response to supply chain vulnerabilities, businesses adopted new models to make manufacturing more resilient.
Reshoring
This refers to companies bringing production back to their home country. It is particularly visible in high-value industries such as:
Semiconductors
Defense equipment
Medical supplies
High-tech manufacturing
The United States, Europe, and Japan have introduced incentives to attract domestic production and reduce reliance on distant suppliers.
Nearshoring
Here, manufacturing is relocated to neighboring or nearby countries. This reduces transportation time, lowers geopolitical risk, and improves supply chain visibility. For example:
U.S. companies increasingly manufacture in Mexico instead of China.
European companies are shifting production to Eastern Europe and North Africa.
Friendshoring
This strategy focuses on sourcing from politically allied countries. The goal is to insulate supply chains from geopolitical conflict. For example:
Western countries are sourcing critical minerals from Australia, Canada, and African partners rather than China.
India is becoming a preferred partner due to its democratic governance and strong alignment with global trade norms.
Collectively, these strategies are reshaping the global manufacturing landscape for the next several decades.
4. The Rise of Asia Beyond China
While China remains the world’s largest manufacturing powerhouse, other Asian countries have emerged as strong competitors. This diversification is one of the most significant supply chain shifts of the 2020s.
India
India is positioning itself as the next major global manufacturing hub. Government initiatives like Make in India, production-linked incentives (PLIs), and improved logistics infrastructure (such as the Dedicated Freight Corridors) have attracted multinational investment. Apple, Samsung, and major automotive firms are rapidly expanding Indian production.
Vietnam
Vietnam has become a preferred destination for electronics manufacturing, benefiting from:
Low labor costs
Business-friendly policies
Strategic location in Southeast Asia
Companies such as Foxconn, Samsung, and Nike have expanded operations here.
Indonesia, Thailand, Malaysia
These countries are strengthening their roles in electronics, automotive components, and natural resource processing.
The shift toward a more diversified Asian supply chain reduces global reliance on a single country and makes the system more stable.
5. Technology-Driven Transformation
Digitization is another major driver of supply chain evolution. Businesses are adopting advanced technologies to improve efficiency, transparency, and resilience.
Artificial Intelligence
AI helps forecast demand, optimize inventory, and predict disruptions. Companies now rely on real-time analytics instead of outdated forecasting models.
Automation and Robotics
Manufacturing automation increases efficiency and reduces dependence on low-cost labor. This is one reason reshoring has become economically feasible.
Blockchain
Blockchain enhances transparency by enabling end-to-end tracking of goods. It is particularly valuable in industries like food, pharmaceuticals, and luxury goods.
Internet of Things (IoT)
Connected devices provide real-time data on shipping conditions, machine performance, warehouse operations, and more.
Together, these technologies are creating intelligent supply chains that can adapt quickly to disruptions.
6. The Sustainability Imperative
Environmental concerns are reshaping global production. Governments are enforcing stricter climate policies, and customers increasingly demand sustainable products.
Major shifts include:
Reduced carbon footprints in transportation and manufacturing
Adoption of renewable energy in factories
Transition to circular supply chains (recycling, reuse, repair)
Low-emission logistics such as electric trucks and green shipping routes
Sustainability is no longer optional—it is a competitive requirement.
7. Logistics Reinvention and New Trade Routes
Recent years have seen major investments in logistics infrastructure to support evolving supply chains.
India’s logistics reforms, including the Unified Logistics Interface Platform (ULIP)
The Belt and Road Initiative, expanding Asia-Europe connectivity
Arctic shipping routes, becoming more accessible due to climate change
Middle Eastern logistics hubs like UAE, Saudi Arabia, and Qatar rapidly expanding
Supply chains are becoming multi-polar rather than centered on a few regions.
8. The Future of Global Supply Chains
Looking ahead, global supply chains will continue evolving along these major themes:
More regionalized manufacturing rather than globalized concentration
Higher use of automation to cut costs and increase efficiency
Greater emphasis on resilience and flexibility
Continued political influence shaping trade patterns
Faster adoption of digital supply chain networks
In the long run, the global economy will benefit from supply chains that are more diversified, technologically advanced, and environmentally sustainable.

Premium vs Discount Zones: Where Smart Money PositionsPrice doesn’t move in a straight line. It oscillates within swings, creating areas where buying or selling becomes more favourable.
Understanding premium and discount zones is how professionals identify where the market offers opportunity and where it carries unnecessary risk. It is a simple framework, but it shifts your mindset from chasing movement to positioning with intention.
Every significant swing in price has two halves. The upper half of a swing is the premium zone; the lower half is the discount zone. Premium is where smart money distributes or looks for short exposure. Discount is where accumulation and long positioning become attractive.
These zones reflect nothing more than logic: buy lower than average, sell higher than average.
To identify these areas, start by marking a clear swing high and swing low. The midpoint between them creates an equilibrium.
Above that midpoint, the market trades at premium; below it, at discount. This doesn’t guarantee reversal points, but it provides structure for understanding where traders with size can enter with reduced risk.
In an uptrend, the goal is to position within discount zones.
Buying in premium exposes you to deeper retracements, failed impulses, and weaker continuation. Discount buying aligns you with the dominant direction while keeping your risk defined.
In downtrends, the logic reverses: premium becomes the ideal zone to sell into, not chase.
What elevates this concept is combining it with liquidity and structure. A discount zone with a strong higher low carries far more weight than discount alone. A premium zone paired with equal highs or a liquidity sweep becomes a cleaner short.
These layers create clarity on where the market is likely to react, rather than relying on individual candles.
Premium and discount zones also prevent emotional trading. When price is in premium during an uptrend, the temptation to chase a breakout is high. The framework reminds you that continuation is less probable and patience often pays.
When price enters discount, the market offers a logical window to build positions without relying on prediction.

Ethereum Could Lead the Next Tokenization BoomEthereum could be at the center of the next big crypto cycle. It has strong long‑term potential, even after big price drops.
Tokenization
In the 70s the dollar left the gold standard, and Wall Street built new products like money‑market funds and futures to keep the dollar dominant.
Today something similar is happening with stablecoins: they turn the dollar into a 24/7 digital token on a blockchain, usually backed by US Treasuries.
If dollars can be tokens, then in time stocks, bonds and other assets can also be tokenized and traded all the time, not just during normal market hours.
Why Ethereum
Bitcoin is treated like “digital gold” mainly a store of value.
Ethereum is a smart‑contract platform. It lets people build apps, tokenize assets and run code directly on the chain.
Big banks and asset managers will need a smart‑contract chain for tokenized products, and Ethereum’s size, developer base and track record give it an edge, even though other blockchains may also grow.
Conclusion
Ethereum it is more than just a coin, it is a programmable blockchain where money, apps, and real‑world assets can all live together. As more dollars, stocks, bonds and other assets get “tokenized” so they can trade 24/7, big investors and banks will need a reliable smart‑contract platform, and today Ethereum is the largest and most proven option with a huge developer community.
The Bell Curve: Understanding Normal Distribution in TradingMost traders have seen the “bell curve” at some point, but very few actually use it when they think about risk and returns.
If you really understand the normal distribution, you’re already thinking more like a risk manager than a gambler.
1. What is the normal distribution?
The normal distribution is a probability distribution that describes how values tend to cluster around an average.
If you plotted a huge number of outcomes (for example, daily returns or P&L per trade), the shape you’d get would often look like a symmetric bell :
- Most observations are close to the center.
- As you move away from the center in either direction, outcomes become less frequent.
- Extreme gains and losses are possible, but they’re relatively rare.
Mathematically, a normal distribution is usually written as N(μ, σ):
μ (mu) is the mean – the average outcome.
σ (sigma) is the standard deviation – a measure of how widely the outcomes are spread around that mean.
In trading terms:
If your returns roughly follow a normal distribution, you should expect many small wins and losses clustered near zero, and only occasional large moves in either direction.
2. Mean (μ): the “drift” of your system
The mean is the point at the center of the distribution. On a chart of returns, this is where the bell is highest.
If μ > 0, the bell is shifted slightly to the right → your system is profitable on average.
If μ < 0, it’s shifted to the left → your system slowly loses money over time.
For a trading strategy, μ is basically your edge. It doesn’t need to be huge. Even a small positive mean return, if it’s consistent and combined with disciplined risk management, can compound strongly over the long run.
3. Standard deviation (σ): volatility in one number
The standard deviation controls how wide or narrow the bell curve is.
- A small σ gives a tall, narrow bell → outcomes are tightly clustered around the mean.
- A large σ gives a short, wide bell → outcomes are more spread out, with bigger swings away from the mean.
Think of σ as a statistical way to describe volatility:
- For an asset: how much its price typically moves relative to its average change.
- For your strategy: how much your returns or daily P&L fluctuate.
Two systems can have the same mean return but very different σ:
- System A: μ = 0.2%, σ = 0.5% → relatively smooth ride.
- System B: μ = 0.2%, σ = 2% → same edge, but a wild equity curve and deeper drawdowns.
Same average, totally different emotional and risk profile.
4. The 68–95–99.7 rule
One of the most useful features of the normal distribution is how predictable it is. Roughly:
- About 68.2% of observations lie within ±1σ of the mean.
- About 95.4% lie within ±2σ.
- About 99.7% lie within ±3σ.
So if daily returns of an asset were approximately normal with:
- Mean μ = 0.1%
- Standard deviation σ = 1%
Then under that model you’d expect:
- Roughly 68% of days between –0.9% and +1.1%
- Roughly 95% of days between –1.9% and +2.1%
- Only about 0.3% of days beyond ±3%
Anything far outside that ±3σ range is, in theory, a very rare event. In practice, that’s often the kind of day everyone remembers.
5. Why this matters for traders
Even with all its limitations, the normal distribution is a powerful framework for thinking about risk:
Position sizing
If you know (or estimate) the standard deviation of your returns, you can form an idea of what “normal” daily or weekly swings look like, and size positions so those swings are survivable.
Stop-loss logic
Stops that sit right in the middle of the usual noise (within about ±1σ) will get hit constantly.
Stops closer to the ±2σ–3σ region are more aligned with “something unusual is happening, I want to be out.”
Expectation management
Most days and most trades will fall inside the “boring” part of the bell curve.
Understanding that prevents you from overtrading while you wait for the edges of the distribution – the bigger opportunities.
6. The catch: markets are not perfectly normal
Real markets often break the textbook assumptions:
- Returns tend to have fat tails → extreme moves happen more often than a normal distribution would predict.
- Distributions are often skewed → one side (usually the downside) has more frequent or more severe extreme events.
That means:
- A move that looks like a “5σ event” under a normal model might actually be something that happens every few years.
- Risk models based strictly on normal assumptions usually underestimate crash risk.
- Strategies like option selling can look very safe when you only think in terms of a normal distribution, but they are very sensitive to those fat tails.
So the normal distribution should be treated as a baseline model, not as reality itself.
7. Quick recap
The normal distribution is the classic bell curve that describes how values cluster around an average.
It’s parameterized by μ (mean) and σ (standard deviation).
Roughly 68% / 95% / 99.7% of observations lie within 1σ / 2σ / 3σ of the mean in a perfectly normal world.
Markets only approximate this; they usually show fat tails and skew, so extreme events are more common than the simple model suggests.
Even with those limitations, it’s a very useful tool for thinking about returns, drawdowns, and the range of outcomes you should be prepared for.