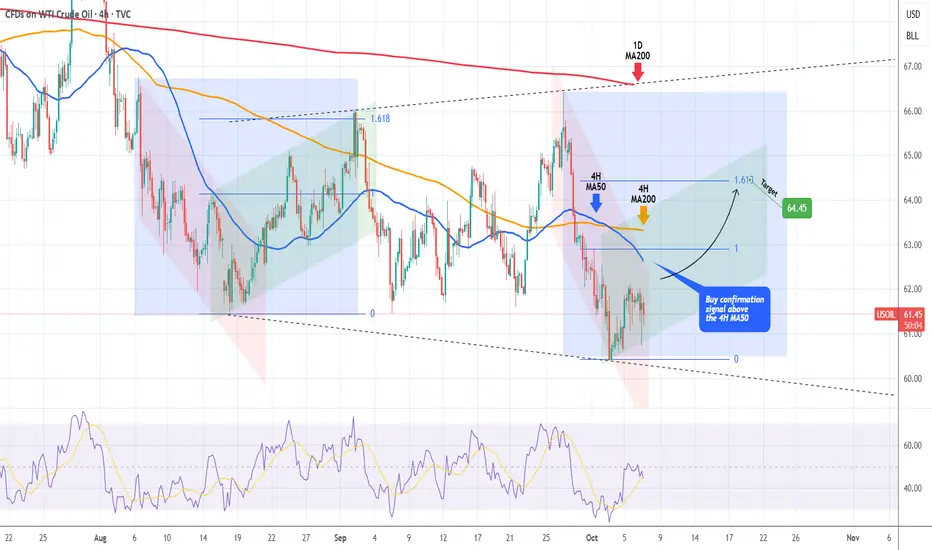
WTI OIL Megaphone bottomed but 4H MA50 gives the signal.WTI Oil (USOIL) has been trading within a Megaphone pattern since the August 18 Low and last Thursday made its latest Lower Low. The 4H RSI instantly rebounded along with the price, after turning oversold (<30.00).
This is technically the start of the pattern's new Bullish Leg. The last one confirmed its start after the price broke above the 4H MA50 (blue trend-line). If it does again, we will take it as a buy signal, targeting the 1.618 Fibonacci at $64.45.
-------------------------------------------------------------------------------
** Please LIKE 👍, FOLLOW ✅, SHARE 🙌 and COMMENT ✍ if you enjoy this idea! Also share your ideas and charts in the comments section below! This is best way to keep it relevant, support us, keep the content here free and allow the idea to reach as many people as possible. **
-------------------------------------------------------------------------------
💸💸💸💸💸💸
👇 👇 👇 👇 👇 👇
#wti#crude#oil
WTI OIL Channel Up bottom buy signalWTI Crude Oil (USOIL) has almost touched the bottom (Higher Lows trend-line) of its September Channel Up, following a strong rejection (Bearish Led) just below the 1D MA200 (orange trend-line).
With the 4H RSI entering its medium-term Buy Zone, we have a strong short-term buy signal at our hands. Our Target is $66.50, expecting a 1D MA200 test, below the 1.1 Fibonacci extension, below which the previous Higher High was priced.
-------------------------------------------------------------------------------
** Please LIKE 👍, FOLLOW ✅, SHARE 🙌 and COMMENT ✍ if you enjoy this idea! Also share your ideas and charts in the comments section below! This is best way to keep it relevant, support us, keep the content here free and allow the idea to reach as many people as possible. **
-------------------------------------------------------------------------------
💸💸💸💸💸💸
👇 👇 👇 👇 👇 👇

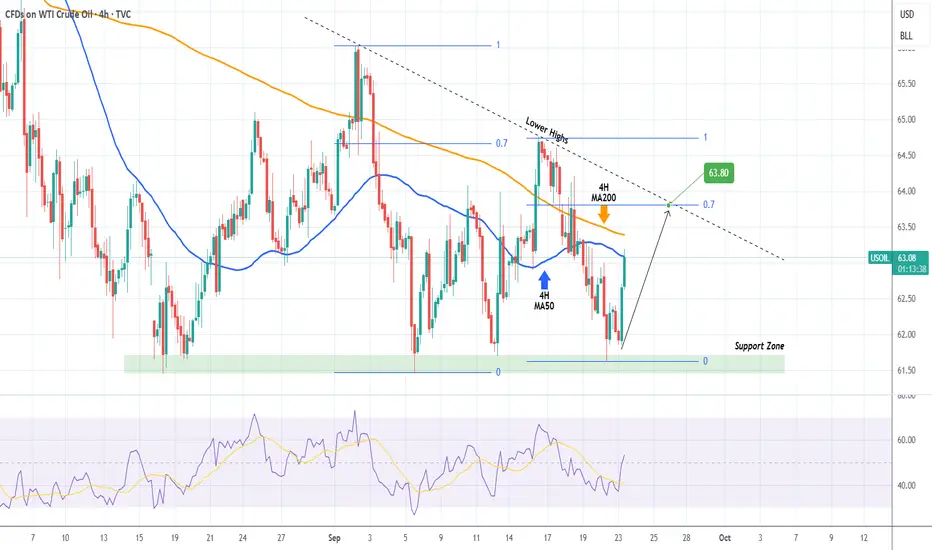
WTI OIL Descending Triangle targeting its top.WTI Oil (USOIL) has been trading within a Descending Triangle and following yesterday's test of its Support Zone, it is rebounding.
This Bullish Leg has already touches the 4H MA50 (blue trend-line) and based on the previous one, it should extend to at least the 0.7 Fibonacci retracement level.
This gives us a 63.80 Target before the pattern's Lower Highs trend-line is tested.
-------------------------------------------------------------------------------
** Please LIKE 👍, FOLLOW ✅, SHARE 🙌 and COMMENT ✍ if you enjoy this idea! Also share your ideas and charts in the comments section below! This is best way to keep it relevant, support us, keep the content here free and allow the idea to reach as many people as possible. **
-------------------------------------------------------------------------------
💸💸💸💸💸💸
👇 👇 👇 👇 👇 👇
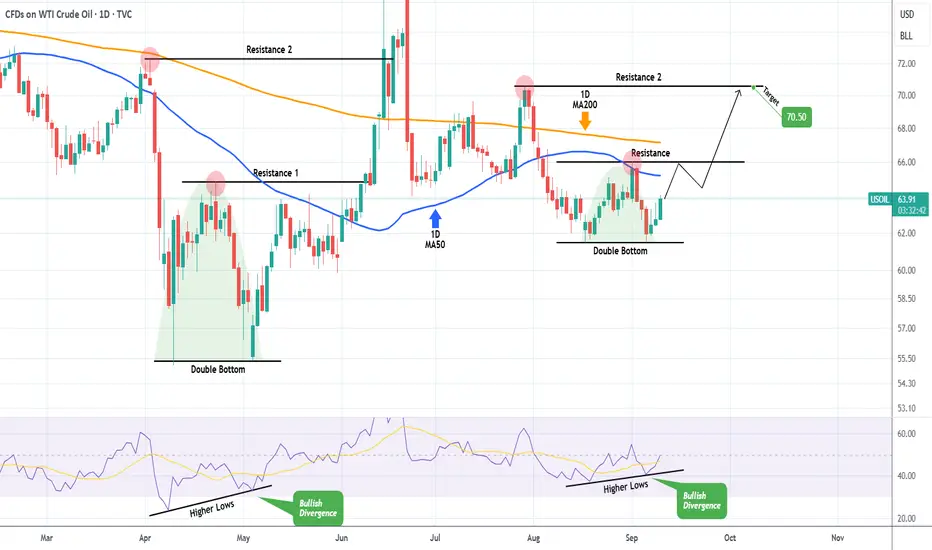
WTI OIL Recent fractal calls for a buy towards $70.50.WTI Oil (USOIL) is on the 3rd straight green 1D candle following a Double Bottom bounce on the 61.50 Support. At the same time the 1D RSI formed Higher Lows, which is a Bullish Divergence.
The same set of conditions emerged on the May 05 bottom rebound, which resulted into initially a 1D MA50 (blue trend-line) test and then a Resistance 2 contact.
As a result, we expect this rise to continue, targeting $70.50.
-------------------------------------------------------------------------------
** Please LIKE 👍, FOLLOW ✅, SHARE 🙌 and COMMENT ✍ if you enjoy this idea! Also share your ideas and charts in the comments section below! This is best way to keep it relevant, support us, keep the content here free and allow the idea to reach as many people as possible. **
-------------------------------------------------------------------------------
💸💸💸💸💸💸
👇 👇 👇 👇 👇 👇
USOIL (WTI) Gann & Harmonic Pattern Points to Major Move!🛢️ 🛢️ USOIL (WTI CRUDE) Points to Major Move! ⚡ 📊
💹 Comprehensive Price Action Strategy | September 2025 Edition 🎯
📈 MARKET SNAPSHOT
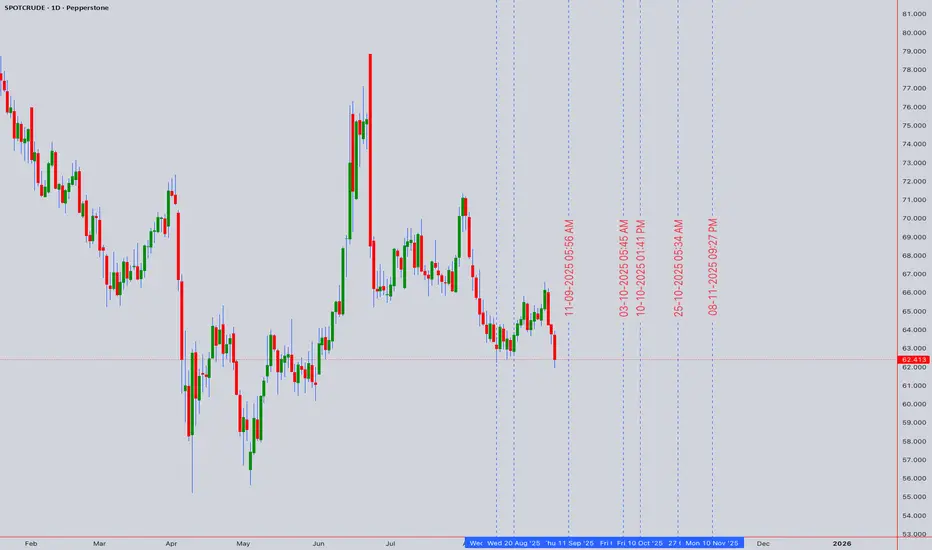
Asset: USOIL (SPOTCRUDE/WTI CASH)
Current Closing Price: $64.413
Date: September 6, 2025
Market Status: 🔴 Critical Support Zone Testing
🎯 EXECUTIVE SUMMARY
WTI Crude Oil is currently trading at $64.413, positioned at a crucial technical juncture. Our multi-timeframe analysis reveals a bearish-to-neutral bias with potential for a significant reversal if key support levels hold. The convergence of multiple technical indicators suggests heightened volatility ahead, presenting both risk and opportunity for astute traders.
📊 COMPREHENSIVE TECHNICAL ANALYSIS
🕯️ Candlestick Pattern Analysis
The recent price action has formed a Bullish Hammer pattern at the $64.00 psychological support level, suggesting potential exhaustion of selling pressure. This formation, combined with increasing volume, indicates possible accumulation phase initiation.
Key Patterns Identified:
- ✅ Bullish Hammer at support
- ⚠️ Evening Star formation on 4H chart
- 📍 Doji cluster indicating indecision
🌊 Elliott Wave Analysis
Current wave count suggests we're completing Wave 5 of a larger corrective structure:
Primary Count: Completing Wave C of ABC correction
Alternative Count: Wave 4 consolidation before final Wave 5 push
Target Zones:
- Bullish: $72.50-$74.00 (Wave 5 extension)
- Bearish: $58.00-$60.00 (Wave C completion)
📐 Harmonic Patterns
A Bullish Bat Pattern is forming on the daily timeframe:
- X: $78.45 (Recent High)
- A: $61.20 (Recent Low)
- B: $71.85 (0.618 Retracement)
- C: $64.41 (Current Price)
- D: $59.80-$60.50 (Projected - 0.886 XA)
Trading Implication: Watch for reversal signals near $60.00 for high-probability long entries.
🔄 Wyckoff Analysis
Current market structure suggests:
Phase: Potential Spring Test within Trading Range
Volume Analysis: Declining volume on recent decline = Lack of selling pressure
Smart Money Behavior: Accumulation signals emerging
Projected Move: Re-accumulation before markup phase
📊 W.D. Gann Analysis
Gann Square of 9 Calculations:
- Current Price: $64.413 sits on 225° angle
- Next Resistance: $68.00 (270° angle)
- Critical Support: $61.00 (180° angle)
Gann Time Cycles:
- September 15, 2025: Major time pivot ⏰
- September 22, 2025: Secondary cycle completion
Gann Fan Analysis:
- Price respecting 2x1 angle from July low
- Break above 1x1 angle at $66.50 signals trend change
☁️ Ichimoku Cloud Analysis
Current Position: Price below cloud - Bearish bias
Tenkan-sen: $65.80 (Immediate resistance)
Kijun-sen: $67.25 (Major resistance)
Cloud Support: $62.00-$63.50
Chikou Span: Bearish, below price 26 periods ago
📉 KEY TECHNICAL INDICATORS
📊 RSI (14-Period)
Current Reading: 42.5
Status: Approaching oversold territory
Divergence: Bullish divergence forming on 4H chart
Signal: Potential reversal zone approaching
📈 Bollinger Bands
Upper Band: $68.20
Middle Band (20 SMA): $65.85
Lower Band: $63.50
Current Position: Testing lower band
Volatility: Bands contracting - Breakout imminent
💹 VWAP Analysis
Daily VWAP: $64.85
Weekly Anchored VWAP: $66.20
Monthly VWAP: $67.50
Volume Profile POC: $65.00 (High volume node)
📊 Moving Averages Confluence
20 EMA: $65.85 ⬇️
50 SMA: $67.20 ⬇️
100 EMA: $69.50 ⬇️
200 SMA: $71.00 ⬇️
Status: Death cross on daily (50/200) - Bearish medium-term
🎯 TRADING STRATEGY
⚡ INTRADAY TRADING (5M-1H)
LONG SETUP 🟢
Entry Zone: $63.80-$64.20
Stop Loss: $63.40 (-1%)
Target 1: $64.80 (+1.5%)
Target 2: $65.40 (+2.5%)
Target 3: $66.00 (+3.5%)
Risk/Reward: 1:3.5
SHORT SETUP 🔴
Entry Zone: $65.60-$65.90
Stop Loss: $66.30 (-1%)
Target 1: $65.00 (-1.5%)
Target 2: $64.40 (-2.5%)
Target 3: $63.80 (-3.5%)
Risk/Reward: 1:3.5
📈 SWING TRADING (4H-DAILY)
BULLISH SCENARIO 🚀
Entry: $64.00-$64.50 (Current levels)
Stop Loss: $61.50 (-4%)
Target 1: $68.00 (+5.5%)
Target 2: $72.00 (+11.8%)
Target 3: $75.50 (+17.2%)
Position Size: 2% portfolio risk
BEARISH SCENARIO 📉
Entry: $65.80-$66.20 (Resistance retest)
Stop Loss: $67.50 (+2%)
Target 1: $62.00 (-6%)
Target 2: $59.50 (-10%)
Target 3: $57.00 (-14%)
Position Size: 1.5% portfolio risk
🗓️ WEEKLY FORECAST
Monday-Tuesday (Sept 9-10) 📅
- Expected Range: $63.50-$65.80
- Bias: Neutral with bullish undertone
- Key Level: Watch $64.00 support hold
Wednesday-Thursday (Sept 11-12) 📅
- Expected Range: $64.00-$67.00
- Bias: Potential breakout day
- Catalyst: EIA Inventory Data
Friday (Sept 13) 📅
- Expected Range: $65.00-$68.50
- Bias: Trend continuation
- Note: Options expiry volatility
🌍 MARKET CONTEXT & FUNDAMENTALS
Geopolitical Factors 🌐
- ⚠️ Middle East tensions supporting price floor
- 🇨🇳 China demand concerns capping upside
- 🇺🇸 SPR refill discussions providing support
Supply/Demand Dynamics ⚖️
- OPEC+ production cuts extended
- US shale production moderating
- Global inventory draws accelerating
Economic Indicators 📊
- Dollar Index weakening (Bullish for Oil)
- Global growth concerns (Bearish pressure)
- Inflation expectations rising (Supportive)
⚠️ RISK MANAGEMENT
Position Sizing Guidelines 💰
Intraday: Max 1-2% account risk per trade
Swing: Max 3-5% account risk per position
Correlation Risk: Monitor energy sector exposure
Stop Loss Strategies 🛡️
1. ATR-Based: 1.5x ATR from entry
2. Structure-Based: Below/above key S/R levels
3. Time-Based: Exit if no movement in 2-3 candles
Risk Factors ⚠️
- 🔴 Break below $61.50 invalidates bullish thesis
- 🔴 Unexpected OPEC+ policy changes
- 🔴 Rapid Dollar strengthening
- 🟢 Surprise inventory draws
- 🟢 Geopolitical escalation
🎯 KEY LEVELS TO WATCH
SUPPORT LEVELS 🟢
S1: $63.50 (Immediate)
S2: $61.50 (Critical)
S3: $59.00 (Major)
S4: $57.00 (Yearly Low)
RESISTANCE LEVELS 🔴
R1: $65.80 (Immediate)
R2: $67.25 (Daily 50MA)
R3: $69.50 (Daily 100MA)
R4: $72.00 (Major)
💡 PRO TRADING TIPS
1. 🎯 Best Entry Times: London/NY overlap (8-11 AM EST)
2. 📊 Volume Confirmation: Look for >20% above average
3. 🔄 Correlation Trades: Monitor USD/CAD inverse relationship
4. ⏰ Avoid Trading: 30 mins before/after EIA releases
5. 📈 Scale Strategy: Add to winners, not losers
🔮 MONTH-END PRICE TARGETS
September 2025 Projections:
Bullish Target: $72.00-$74.00 🎯
Base Case: $66.00-$68.00 📊
Bearish Target: $58.00-$60.00 📉
Probability Assessment:
- Bullish Scenario: 35% 📈
- Base Case: 45% ➡️
- Bearish Scenario: 20% 📉
📌 CONCLUSION & ACTION PLAN
USOIL presents a compelling risk/reward opportunity at current levels. The confluence of technical support at $64.00, combined with oversold conditions and potential harmonic pattern completion, suggests a tactical long position with tight risk management is warranted.
Recommended Strategy:
1. Primary: Accumulate long positions $63.50-$64.50
2. Alternative: Wait for breakout above $66.00 for momentum trades
3. Hedge: Consider put options if below $61.50
📝 TRADING CHECKLIST
Before entering any position:
- ✅ Confirm volume supports move
- ✅ Check RSI for divergences
- ✅ Verify multiple timeframe alignment
- ✅ Set stop loss before entry
- ✅ Calculate position size
- ✅ Review correlation with DXY
- ✅ Check economic calendar
- ✅ Assess market sentiment
🏷️ *Last Updated: September 6, 2025, 12:54 AM UTC+4*
🔔 Follow for daily updates and real-time trading signals!
For individuals seeking to enhance their trading abilities based on the analyses provided, I recommend exploring the mentoring program offered by Shunya Trade. (Website: shunya dot trade)
I would appreciate your feedback on this analysis, as it will serve as a valuable resource for future endeavors.
Sincerely,
Shunya.Trade
Website: shunya dot trade
⚠️Disclaimer: This post is intended solely for educational purposes and does not constitute investment advice, financial advice, or trading recommendations. The views expressed herein are derived from technical analysis and are shared for informational purposes only. The stock market inherently carries risks, including the potential for capital loss. Therefore, readers are strongly advised to exercise prudent judgment before making any investment decisions. We assume no liability for any actions taken based on this content. For personalized guidance, it is recommended to consult a certified financial advisor.
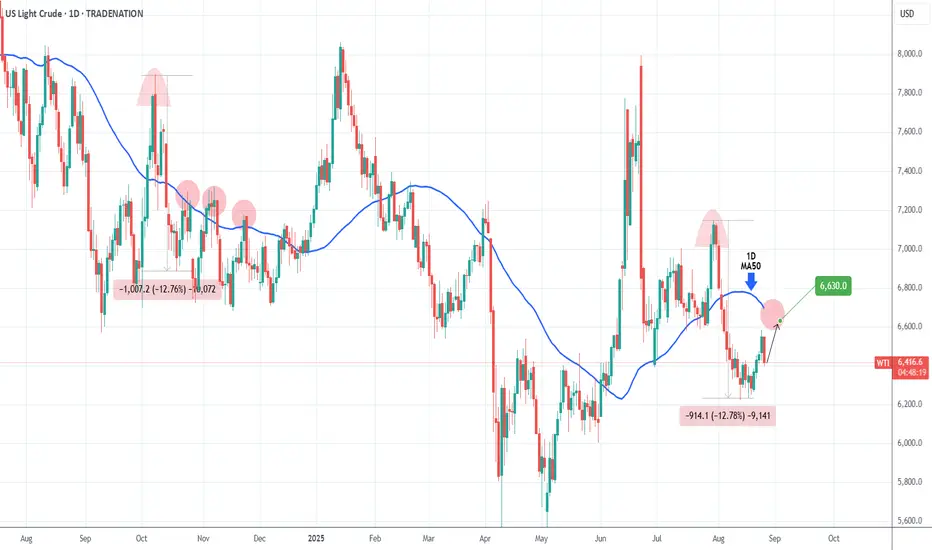
WTI OIL technically more chances to test the 1D MA50. Buy.Last week (August 20, see chart below) we issued a bullish break-out signal on WTI Oil (USOIL) that reached our $65.60 Target within 3 days:
This time we get a new buy signal, despite today's sharp pull-back. The -12.78% decline since the July 30 rejection, resembles the one since the October 08 2024 High.
This rebounded to just above the 1D MA50 (blue trend-line) to form a new Lower High and get rejected again.
As a result, our immediate short-term Target is $66.30.
-------------------------------------------------------------------------------
** Please LIKE 👍, FOLLOW ✅, SHARE 🙌 and COMMENT ✍ if you enjoy this idea! Also share your ideas and charts in the comments section below! This is best way to keep it relevant, support us, keep the content here free and allow the idea to reach as many people as possible. **
-------------------------------------------------------------------------------
Disclosure: I am part of Trade Nation's Influencer program and receive a monthly fee for using their TradingView charts in my analysis.
💸💸💸💸💸💸
👇 👇 👇 👇 👇 👇
WTI OIL Buy signal if the 4H MA50 breaks.WTI Oil (USOIL) appears to have found short-term Support since the August 13 Low, turning sideways, with its 4H RSI however on Higher Lows, thus displaying a Bullish Divergence.
This is similar to the June 24 - July 02 Bullish Divergence, which once it broke above the 4H MA50 (blue trend-line), it topped a little over the 0.382 Fibonacci retracement level.
As a result, we will be waiting for the 4H MA50 bullish break-out signal to target $65.60 (Fib 0.382).
-------------------------------------------------------------------------------
** Please LIKE 👍, FOLLOW ✅, SHARE 🙌 and COMMENT ✍ if you enjoy this idea! Also share your ideas and charts in the comments section below! This is best way to keep it relevant, support us, keep the content here free and allow the idea to reach as many people as possible. **
-------------------------------------------------------------------------------
Disclosure: I am part of Trade Nation's Influencer program and receive a monthly fee for using their TradingView charts in my analysis.
💸💸💸💸💸💸
👇 👇 👇 👇 👇 👇

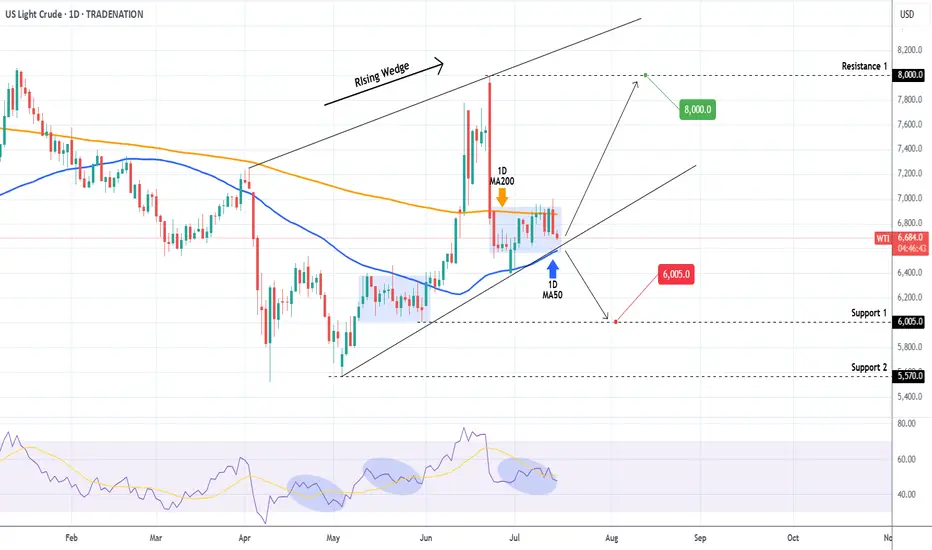
WTI OIL Is it forming a bottom?WTI Oil (USOIL) Has been trading within a Rising Wedge pattern and since June 02, it has turned its 1D MA50 as a Support. Technically the recent 2-week consolidation within the 1D MA50 (blue trend-line) and 1D MA200 (orange trend-line) is a bottom formation on the Higher Lows trend-line of the Rising Wedge.
As long as the 1D MA50 holds, we remain bullish, targeting $80.00 (Resistance 1). If the 1D MA50 breaks (closes a 1D candle below it), we will take the loss, and turn bearish instead, targeting $60.05 (Support 1).
-------------------------------------------------------------------------------
** Please LIKE 👍, FOLLOW ✅, SHARE 🙌 and COMMENT ✍ if you enjoy this idea! Also share your ideas and charts in the comments section below! This is best way to keep it relevant, support us, keep the content here free and allow the idea to reach as many people as possible. **
-------------------------------------------------------------------------------
Disclosure: I am part of Trade Nation's Influencer program and receive a monthly fee for using their TradingView charts in my analysis.
💸💸💸💸💸💸
👇 👇 👇 👇 👇 👇
WTI OIL Best scalping opportunity at the moment!WTI Oil (USOIL) has been consolidating inside a ranged trading set-up, with the 4H MA100 (green trend-line) as its Resistance and the 4H MA200 (orange trend-line) as its Support.
We saw this previously from May 13 to June 01 and it presents the best scaling opportunity in the market at the moment. That previous Ranged Trading pattern eventually broke upwards as the Higher Lows trend-line held.
As a result, after you get your scalping profits within this range, look for a clear break-out above the 4H MA100 (candle closing) in order to go long (Resistance 1) or a break-out below the Higher Lows (candle closing) in order to go short (Support 1).
-------------------------------------------------------------------------------
** Please LIKE 👍, FOLLOW ✅, SHARE 🙌 and COMMENT ✍ if you enjoy this idea! Also share your ideas and charts in the comments section below! This is best way to keep it relevant, support us, keep the content here free and allow the idea to reach as many people as possible. **
-------------------------------------------------------------------------------
Disclosure: I am part of Trade Nation's Influencer program and receive a monthly fee for using their TradingView charts in my analysis.
💸💸💸💸💸💸
👇 👇 👇 👇 👇 👇

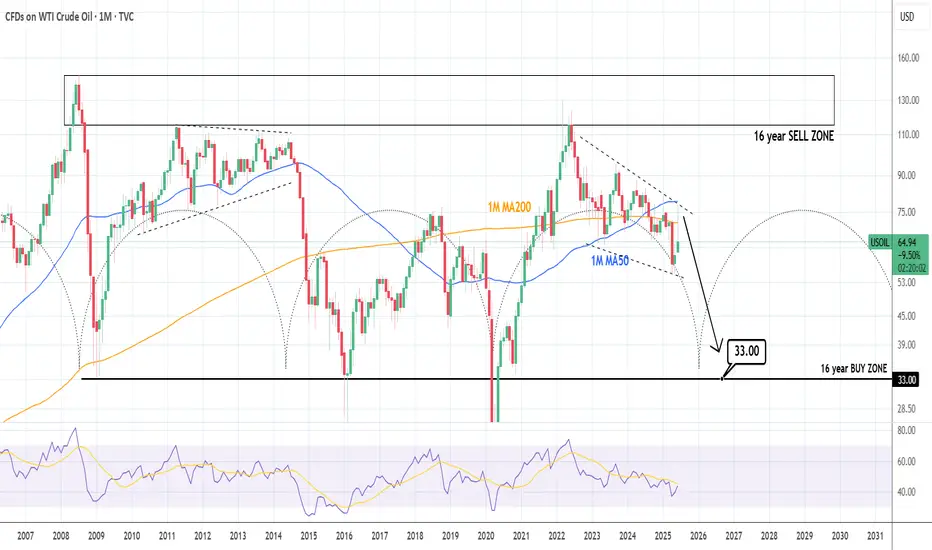
WTI CRUDE OIL: Brutal collapse expectedWTI Crude Oil has turned bearish again on its 1D technical outlook (RSI = 44.990, MACD = 0.310, ADX = 38.289) and is expected to accelerate the effect as based on the 16 year Cycles, late 2025 and most of 2026 should experience a price collapse. The most optimal Buy Zone starts at $33.00, it could go lower but that's a solid base from which to expect a bounce back above $110.00 by 2028.
## If you like our free content follow our profile to get more daily ideas. ##
## Comments and likes are greatly appreciated. ##
WTI OIL Massive rejection on the 1D MA200.WTI Oil (USOIL) has been trading within a Channel Down for over a year now and today its latest Bullish Leg hit the 1D MA200 (orange trend-line) for the first time since February 03 2025.
Unless we see a sustainable structured rise that turns it into a Support, the long-term bearish trend should prevail, and the market has already reacted to this with a strong rejection.
With the 1D RSI almost overbought (>70.00), being consistent with the last 3 major tops, we expect a gradual decline towards Support 1, as it happened on the January - February 2025 Bearish Leg.
Our Target is just above it at $55.50.
-------------------------------------------------------------------------------
** Please LIKE 👍, FOLLOW ✅, SHARE 🙌 and COMMENT ✍ if you enjoy this idea! Also share your ideas and charts in the comments section below! This is best way to keep it relevant, support us, keep the content here free and allow the idea to reach as many people as possible. **
-------------------------------------------------------------------------------
💸💸💸💸💸💸
👇 👇 👇 👇 👇 👇

WTI Crude Oil Stalls At Technical JunctureCrude oil has enjoyed a decent rally in recent weeks thanks to improved sentiment and OPEC+ scaling back production. Yet momentum turned against bulls on Tuesday, despite positive trade talks between the US and China. Today I discuss whether this could be a turning point for oil, or simply a bump in the road.
Matt Simpson, Market Analyst at City Index and Forex.com

WTI Crude Oil Testing Make-or-Break Support ZoneWTI crude is grinding into a pivotal horizontal support near 6,020 after another sharp rejection near the 50-day SMA:
Support at Risk: Price is pressing into the horizontal support zone formed by May’s lows (~6,020). A clean break below would shift momentum back decisively to the downside.
Bearish Structure: Price remains well below both the 50- and 200-day SMAs, which are angled downward—consistent with a medium-term downtrend.
Momentum Fading: MACD is negative and turning lower again, while RSI is stuck near 45 and showing no bullish divergence.
Next Support: If support fails, next downside level is likely around the YTD low near 5,400.
As it stands, bears remain in control unless bulls can defend this floor and drive a breakout back above the 50-day SMA.
-MW

WTI CRUDE OIL: Short term rebound on RSI Bullish DivergenceWTI Crude Oil is bearish on its 1D technical outlook (RSI = 38.958, MACD = -2.110, ADX = 28.985) as it remains on a multi-month Low. The 1D RSI however displays a HL Bullish Divergence and this can cause a short term price rebound. The Resistance is the Pivot Zone and short term the LH trendline is what maintains the downtrend. Consequently, we are now bullish, TP = 64.90.
## If you like our free content follow our profile to get more daily ideas. ##
## Comments and likes are greatly appreciated. ##

WTI CRUDE OIL: Channel Down bottomed. Buy opportunity.WTI Crude Oil is heavily bearish on its 1D technical outlook (RSI = 38.039, MACD = -2.310, ADX = 38.046) as it is trading inside a Channel Down for more than 1 year. Last week's low has made a technical LL at the bottom of the pattern and the current consolidation indicates that this may be an attempt to initiate the new bullish wave. The 1D RSI recovered from being oversold previously and this potentially hints to a rebound over the 1D MA200. The last bullish wave crossed above the 0.618 Fibonacci marginally. Trade: long, TP = 71.00.
## If you like our free content follow our profile to get more daily ideas. ##
## Comments and likes are greatly appreciated. ##

WTI CRUDE OIL: Potential bottom and massive rebound to 71.00.WTI Crude Oil got oversold on its 1D technical outlook (RSI = 31.096, MACD = -1.620, ADX = 38.232) but is recovering its 1W candle now as it hit the bottom (LL) of the 1 year Channel Down. If the 1W candle makes a green closing, we will consider this a bottom, as the 1W RSI is also on its LL trendline) and go for a long aimed as the previous one at the 0.618 Fibonacci (TP = 71.00).
## If you like our free content follow our profile to get more daily ideas. ##
## Comments and likes are greatly appreciated. ##

WTI crude oil shows the potential for a bounceThis is a bit of a scrappy chart, but I still see the potential for a cheeky bounce.
WTI crude oil is trying to snap a 4-week losing streak, by stalling around a 50% retracement level. Last week's candle was an inverted hammer, and the previous two weeks have both closed above the 50% level.
A bullish divergence formed on the daily RSI (2) ahead price action finding support at the 200-day SMA and 200-day EMA.
From here, the bias remains bullish while prices hold above last week's low. Bulls could seek dips towards the 200-day MAs, with a near-term upside target of $72. A break above which brings $74 into focus, near the monthly pivot point.
Matt Simpson, Market Analyst at City Index and Forex.com

WTI selloff stalls around cluster of big levelsWTI crude has seen a 11% correction from its January high, and 11 of the past 13 days since the high have been down days. But there is a glimmer of hope for bulls as prices are holding above several key levels of support, just above the $70 handle.
Tuesday's bullish pinbar held above respected the 200-day EMA and 50% retracement levels, while respecting the 200 and 50-day EMAs. It also saw a minor (and ultimately false) break of the $71 handle and November high.
While Wednesday was a down day, it was also an inside day. And this suggests a hesitancy to break immediately lower with demand around $71.
This may be on the scrappy side, but bulls could consider longs around the current lows and seek a rebound to either Wednesday's high, just beneath the $73. Though a higher target could be considered should a fundamentally bullish catalyst arrive.
The bias remains bullish above $70, but $70.49 could also be used to improve the reward-to-risk ratio.
Matt Simpson, Market Analyst at City Index

WTI CRUDE OIL: Rebound to 75.50 very probable.WTI Crude Oil is bearish on its 1D technical outlook (RSI = 40.837, MACD = 0.030, ADX = 37.618) which is natural as it's trading inside a Channel Down. The pattern formed a 4H Death Cross yesterday and even though it's technically bearish, the last time it was formed (October 24th 2024), it marked a bottom 4 days later. The bottom was formed on a HL trendline and if it gets repeated, we should see a HL rebound soon. As with November's rebound, we will be targeting the 0.5 Fibonacci level (TP = 75.50).
## If you like our free content follow our profile to get more daily ideas. ##
## Comments and likes are greatly appreciated. ##

WTI CRUDE OIL: Buy opportunity on the bottom trendline.WTI Crude Oil remains bullish on its 1D technical outlook (RSI = 58.480, MACD = 1.830, ADX = 66.542) despite the 4 day selling streak, which pushed the price under the 4H MA50. The HL trendline is still intact though, so technically that is a sound buy opportunity, especially if the 1D RSI hits the 30.000 oversold level. We're bullish (TP = 86.00).
## If you like our free content follow our profile to get more daily ideas. ##
## Comments and likes are greatly appreciated. ##

CRUDE OIL CORRECTION AHEAD|SHORT|
✅CRUDE OIL is about to retest a key structure level of 80.14$
Which implies a high likelihood of a move down
As some market participants will be taking profit from long positions
While others will find this price level to be good for selling
So as usual we will have a chance to ride the wave of a bearish correction
SHORT🔥
✅Like and subscribe to never miss a new idea!✅

WTI CRUDE OIL: Bullish fractal from 2023 targets $78.50.WTI Crude Oil is neutral on its 1D technical outlook (RSI = 51.153, MACD = 0.060, ADX = 20.101) as it is trading around its 1D MA50 but at the same time remains supported on the S1 Zone. In the meantime the 1D RSI is rising on HL, which is a bullish divergence. This set of dynamics are identical to March-June 2023, when WTI was contained over the S1 Zone but the RSI was pointing to a bullish divergence that eventually caused a bullish breakout. Consequently, we are bullish now, aiming again at the R1 level (TP = 78.50).
## If you like our free content follow our profile to get more daily ideas. ##
## Comments and likes are greatly appreciated. ##

WTI OIL Major bullish break-out happened. Expect rally to $76.WTI Oil (USOIL) broke yesterday above the 1-month Lower Highs trend-line, following the bullish EIA report. This is a major bullish break-out as the last time the price broke above a similar Lower Highs trend-line was on October 01, with the resulting rally rising above the 0.786 Fibonacci retracement level.
Even the 4H RSI sequences between the two fractals are identical, with both starting on a Bullish Divergence (Higher Lows against the price's Lower Lows and then a nearly oversold RSI with the price on the Support Zone was what initiated the rebound that broke the Lower Highs.
Our Target is again the 0.786 Fib at $76.00.
-------------------------------------------------------------------------------
** Please LIKE 👍, FOLLOW ✅, SHARE 🙌 and COMMENT ✍ if you enjoy this idea! Also share your ideas and charts in the comments section below! This is best way to keep it relevant, support us, keep the content here free and allow the idea to reach as many people as possible. **
-------------------------------------------------------------------------------
💸💸💸💸💸💸
👇 👇 👇 👇 👇 👇
