Bitcoin Analysis (4H)Bitcoin is in a bearish phase. It appears that Wave C of the bearish phase has transformed into a dimaetric.
The price is expected to bounce back from the green zone toward the upside, and then we may see the main rejection from the red box. The bullish wave we are expecting for Bitcoin corresponds to Wave D.
Let’s see whether a double bottom forms to support the price upward or not.
A daily candle close below the invalidation level will invalidate the bullish Wave D.
For risk management, please don't forget stop loss and capital management
When we reach the first target, save some profit and then change the stop to entry
Comment if you have any questions
Thank You
1-BTCUSD

BITCOIN GET READY FOR MASSIVE HIGH PROBABILITY BULL MOVE SOON!!!🚨 BITCOIN HIGH PROBABILITY BUY SETUP 🚨
* Here We Can See Clearly The Next Potential Moves For BTCUSD Coming Hours/Days.
* Keep Your Eyes Close On Your Trading Positions.
* Happy PIP Hunting Traders.
FXKILLA.

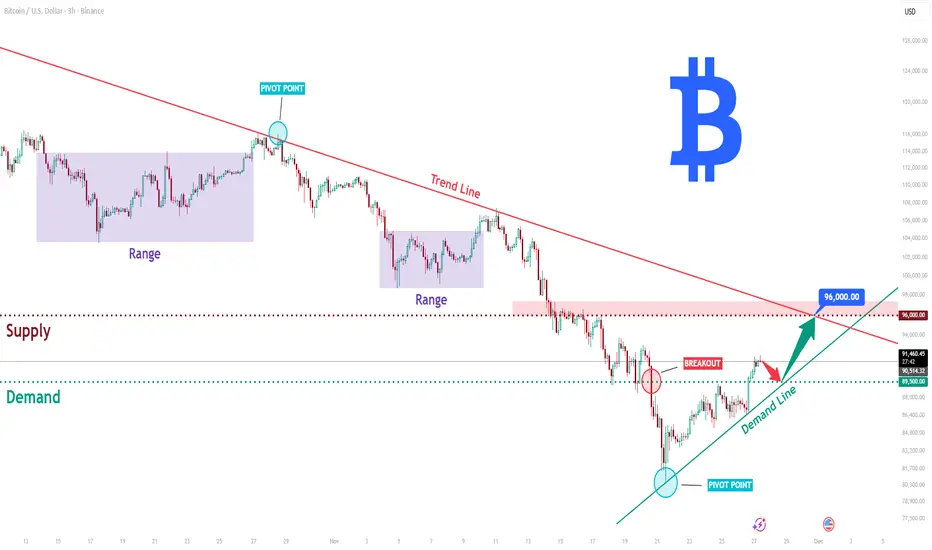
BTCUSD Long: Compression Near Trend Line, Possible Move to $96KHello, traders! BTCUSD continues to move within a broader descending structure, where the price has consistently respected the major downward trend line. Each approach to this trend line has resulted in a new lower high, confirming seller control in the medium-term outlook.
Currently, after the decline, Bitcoin tested the Demand Zone around $89,500, where buyers formed an important pivot point, triggering a noticeable upward impulse. This reaction confirmed strong demand and pushed the price toward the key compression area between the Demand Line and the main descending Trend Line.
My scenario, if buyers maintain pressure and break above the descending trend line, BTCUSD may extend its bullish correction toward the $96,000 supply zone. However, if the demand level fails to hold, this scenario becomes invalid, opening the path toward deeper support levels. Manage your risk!
BTCUSD H1 | Bearish Reaction Off Key ResistanceMomentum: Bearish
Price is currently below the ichimoku cloud, and has broken past the previous ascending trendline.
Sell entry: 90,257.4
- Strong pullback resistance
- 61.8% Fib retracement
- 61.8% Fib projection
Stop Loss: 93,125.45
- Multi-swing high resistance
Take Profit: 85,488.56
- Overlap support
High Risk Investment Warning
Stratos Markets Limited (tradu.com/uk ), Stratos Europe Ltd (tradu.com/eu ):
CFDs are complex instruments and come with a high risk of losing money rapidly due to leverage. 70% of retail investor accounts lose money when trading CFDs with this provider. You should consider whether you understand how CFDs work and whether you can afford to take the high risk of losing your money.
Stratos Global LLC (tradu.com/en ): Losses can exceed deposits.
Please be advised that the information presented on TradingView is provided to Tradu (‘Company’, ‘we’) by a third-party provider (‘TFA Global Pte Ltd’). Please be reminded that you are solely responsible for the trading decisions on your account. Any information and/or content is intended entirely for research, educational and informational purposes only and does not constitute investment or consultation advice or investment strategy. The information is not tailored to the investment needs of any specific person and therefore does not involve a consideration of any of the investment objectives, financial situation or needs of any viewer that may receive it. Past performance is not a reliable indicator of future results. Actual results may differ materially from those anticipated in forward-looking or past performance statements. We assume no liability as to the accuracy or completeness of any of the information and/or content provided herein and the Company cannot be held responsible for any omission, mistake nor for any loss or damage including without limitation to any loss of profit which may arise from reliance on any information supplied by TFA Global Pte Ltd.

BTC/USDT — Weekly Outlook✔️ The monthly candle closed bearish with a lower wick. RSI has dropped into deep-correction territory (5 more points — and it hits the COVID-crash level). The structure increasingly resembles 2021.
✔️ Bitcoin recovered 4% during the week — but already lost 5% this morning.
🟢 QT officially ended today after 3.5 years . During this period, the Fed’s balance sheet shrank from $9T to $6.6T.
🟢 Positive cumulative delta: +$640M
🟠 Deviation below the channel has been closed — technically opening the path downward.
🟠 ETF flows: green on the week, red on the month.
🟠 Fear index moved from extreme fear back to regular fear — likely not for long.
🔴 Nearly the entire bounce has been retraced. A reversal is possible only after a clear reversal pattern forms. One step back before two steps forward.
🔴 The shortest bear phase in history lasted 1.5 months — that’s the most optimistic benchmark.
🧠 If the scenario plays out, we may see one more drop and a strong buyback within the next month.
A sweep below 80k is possible.
I expect a reversal starting from early January — holiday periods make market manipulation even easier.

#BTC/USDT is currently strongly bullish#BTC
The price is moving in a descending channel on the 1-hour timeframe. It has reached the lower boundary and is heading towards breaking above it, with a retest of the upper boundary expected.
We have a downtrend on the RSI indicator, which has reached near the lower boundary, and an upward rebound is expected.
There is a key support zone in green at 85249. The price has bounced from this zone multiple times and is expected to bounce again.
We have a trend towards stability above the 100-period moving average, as we are moving close to it, which supports the upward movement.
Entry price: 86624
First target: 87386
Second target: 88635
Third target: 90106
Don't forget a simple principle: money management.
Place your stop-loss below the support zone in green.
For any questions, please leave a comment.
Thank you.

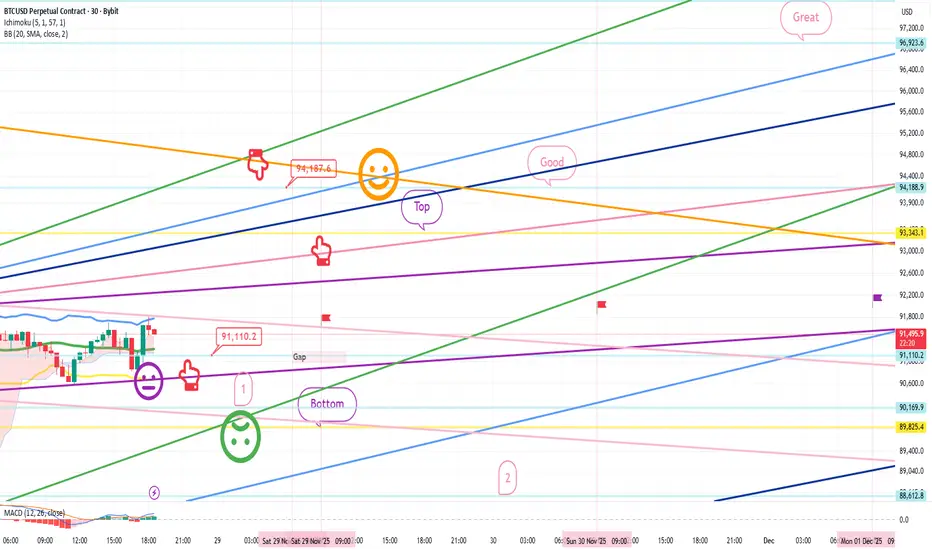
November 28 Bitcoin Bybit chart analysis Hello It's a BitcoinHello
It's a Bitcoin Guide.
If you "follow"
You can receive real-time movement paths and comment notifications on major sections.
If my analysis was helpful,
Please click the booster button at the bottom.
This is the Nasdaq 30-minute chart.
Today is an early closing day due to Thanksgiving.
*Roughly speaking, among the red finger long position strategies,
the rebound after touching the first section is a vertical rise.
25.2K -> Bottom is a safe zone for long positions,
and the lowest point, 25,098.7K, is the 1+4 section.
While today's sideways movement is most likely,
I've also calculated major fluctuations just in case.
I've applied this directly to Bitcoin.
This is Bitcoin's 30-minute chart.
I assumed the Nasdaq would move sideways,
and conducted a 1:1 analysis with Tether Dominance.
It first touched the lower Bollinger Band (the area where the 30-minute and 1-hour support levels touch and shake simultaneously).
The danger signal was the MACD dead cross on the 4-hour chart.
Since the Ichimoku Kinko Hyo has a thick bullish cloud,
I set a short stop-loss, ignored the 4-hour MACD dead cross, and operated aggressively.
*When the red finger moves,
One-way long position strategy.
1. $91,110.2 long position entry point / Stop-loss price if the purple support line is broken.
2. $94,187.6 long position primary target -> Great secondary target.
If the strategy is successful, the top area can be used as a long position re-entry point.
Instead, the Top -> Good section is the center line of the daily Bollinger Band chart, so a strong correction is likely.
Also, the purple flag marked on the far right indicates the area where a new monthly candlestick is formed next month.
A strong rebound this weekend is unavoidable, as the monthly MACD dead cross could be resolved. Even if the Great section is formed at the top, closing down to the gap section formed over the weekend is the best option for long positions.
(Possibility of a December bull market without the risk of a monthly MACD)
The first section + the bottom section at the bottom is the safest area for long positions, with the possibility of a sideways movement.
Up to the second section is open after the bottom section is broken.
This is because the second touch, between the 4-hour Bollinger Band center line and the 6-hour Bollinger Band center line, could lead to a strong push without support.
Up to this point, I ask that you use my analysis for reference only.
I hope you operate safely, with a focus on principled trading and stop-loss orders.
Thank you for your hard work this week.
Thank you.
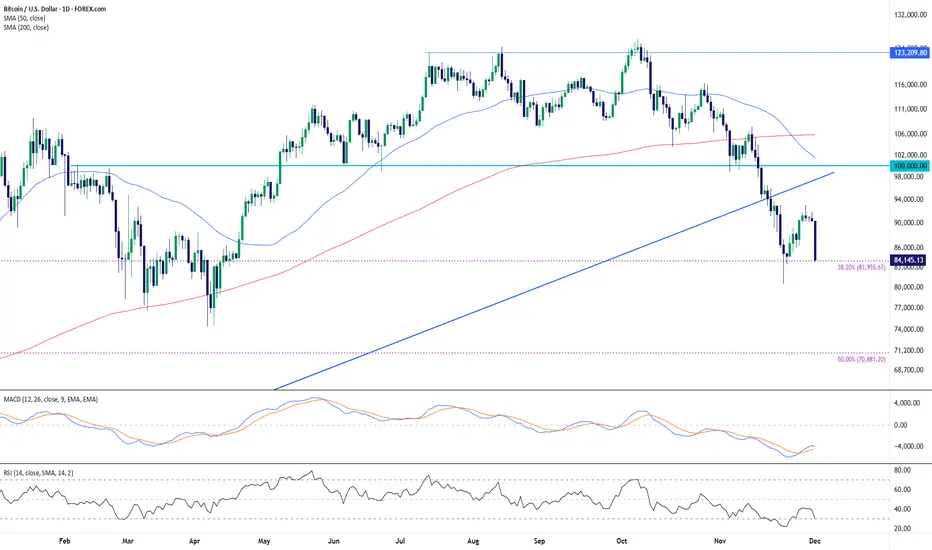
Bitcoin Extends Decline Toward Fibonacci Support as Momentum RemBitcoin continues to trade under clear downside pressure after breaking beneath its long-standing ascending trendline in November. The recent rebound attempt stalled near the underside of that same trendline—now acting as dynamic resistance—and price has since rotated lower again.
The broader structure shifted bearish once price fell below the 50-day SMA and 200-day SMA, both of which are now flattening or turning lower. This places the market in a momentum-cooling environment where sellers remain in control unless a sustained recovery develops above key moving averages.
The chart also highlights confluence around the 38.2% Fibonacci retracement level drawn from the major swing low, which sits near the latest reaction zone. The initial bounce from this area shows that participants are aware of the level, though the follow-through remains limited for now.
Momentum indicators reflect persistent weakness. The MACD remains in negative territory, with both signal lines tracking below zero and only modest signs of stabilization. RSI recently dipped into the 30-zone before attempting to lift, indicating oversold conditions were tested but broader momentum has not convincingly recovered.
Overall, the chart continues to lean bearish as long as the market holds below the broken trendline and the major moving averages. Price behavior around the Fibonacci region will be an important gauge of whether this decline matures into a deeper corrective phase or begins to base out.
-MW
BTC Is Heating Up — The Next Big Move Is Closer Than You Think!1. Market Analysis (Updated)
Bitcoin has just touched $89,000, aligning perfectly with the recovery structure we expected earlier. After the deep drop toward the $80,000–$85,000 zone, buyers stepped in aggressively, creating a clean rebound and pushing price back into momentum territory.
Today’s move coincides with a strong rally in U.S. tech stocks, shifting overall sentiment toward risk-on assets — a boost that often strengthens crypto markets.
However, the sharp drop earlier this week triggered over $200M in long liquidations, exposing how fragile leveraged positions are in current conditions. This volatility shows that while buyers are present, the broader market still carries elevated risk.
ETF inflows are slowly returning, supporting Bitcoin’s liquidity and helping stabilize short-term price swings. Yet several analysts warn the recent bounce could still be a “dead-cat bounce” if BTC fails to reclaim key structural levels.
In short:
Momentum is back — but conviction is not yet confirmed.
2. Technical Structure Update
The chart shows:
- A major Support Zone at $85,000–$86,000 — recently tested and respected.
- The current rally brings BTC back toward the $89,000–$90,000 Resistance Zone, which previously acted as a pivot and rejection point.
- If price stabilizes and breaks above this zone with strength, the bullish recovery could expand toward higher targets.
- If price gets rejected here, downside pressure can quickly return.
Right now, BTC is trading at a decision point.
3. Scenarios & Trading Strategy
🔸 Main Scenario – Bullish Continuation (Higher Probability)
If BTC holds above $89,000 and successfully breaks through $90,000, price may aim for:
Target 1: 92,500
Target 2: 94,000+
Why this matters:
- Tech-stock rally boosts risk appetite
- ETF inflows returning
- Liquidations flushed weak long positions → cleaner market structure
Strategy: Buy dips above $89K, wait for breakout confirmation.
🔹 Sub Scenario – Bearish Rejection (Caution Required)
If BTC fails to hold $89,000, and especially if it breaks below $86,000, the structure turns bearish again.
Downside targets: 83,000 - 80,000
Why?
- Market still fragile
- Heavy liquidation clusters below
- Risk sentiment turns quickly if buyers lose strength
Strategy: Expect lower highs → potential short setups toward support zones.
4. Summary & Personal View
- Overall Trend: Neutral → Slightly Bullish
- Short-Term Bias: Bullish above $89K; Bearish below $86K
- Momentum: Returning, but not fully confirmed
- Opportunity: High volatility = high reward if risk is managed
- Caution: Market still sensitive to macro news & ETF flows
BTC is entering a decisive phase — the next move will shape the rest of the week.
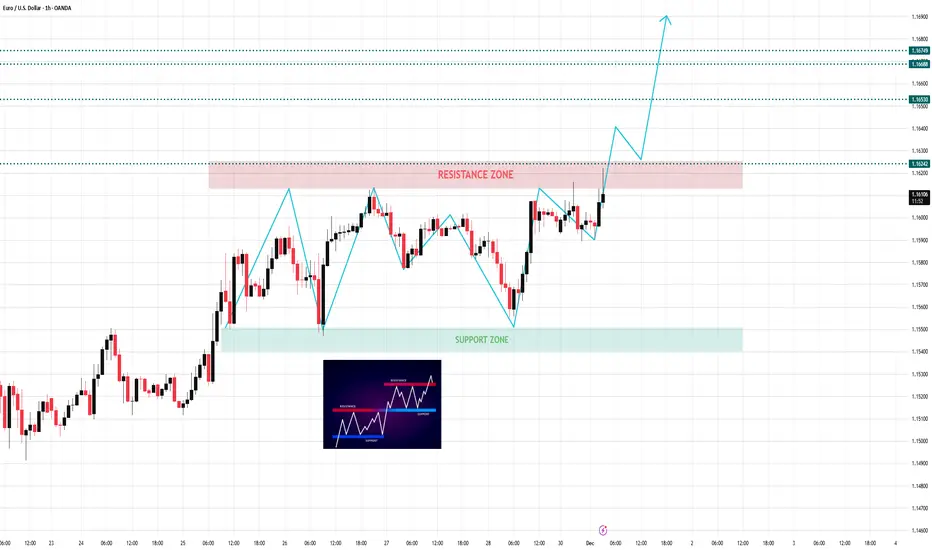
EURUSD Is Coiling for a Breakout — The Next Push Could Be ExploZ1. Market Analysis
EURUSD is currently trading in a clean and well-defined structure, showing a gradual shift from consolidation to bullish momentum. Price has been oscillating between the Support Zone (1.1540–1.1550) and the Resistance Zone (1.1618–1.1624) , forming a sequence of Higher Highs and Higher Lows — a textbook bullish staircase pattern.
The support zone has acted as a strong demand region, rejecting price multiple times and building a foundation for continuation. Each test of resistance is becoming stronger, and the most recent bullish impulse shows increased momentum compared to previous swings. This indicates that buyers are gaining confidence as liquidity builds above the resistance line.
The current price action is also forming a Bullish Continuation Pattern, identical to the reference image at the center of your chart. This suggests accumulation below resistance before a potential breakout.
As long as EURUSD stays above the bullish micro-structure, sentiment continues to favor the upside.
2. Technical Structure Breakdown
Key Observations:
- Support Zone at 1.1540–1.1550 continues to hold strongly
- Multiple successful retests indicate strong buyer presence
- A clean Resistance Zone at 1.1618–1.1624 is the final barrier before expansion
- Market structure is forming a staircase pattern → consistent HH + HL
- The recent bullish leg has more momentum than previous ones
This is a classic bullish breakout setup, supported by structure and liquidity alignment.
3. Market Scenario & Strategy
🔸 Main Scenario – Bullish Breakout (High Probability)
Price is currently testing the resistance zone with strong bullish structure behind it.
If price closes above 1.1624, expect continuation toward:
🎯 Target 1: 1.16530
🎯 Target 2: 1.16688
🎯 Target 3: 1.16749+ (extended liquidity zone)
A clean breakout → retest → continuation pattern is the expected sequence.
Strategy:
Look for long entries on:
✔ Break + retest of 1.1624
✔ Or pullback into minor higher low structure
Momentum is on the buyer’s side.
🔹 Sub Scenario – Correction Before Breakout
If price gets temporarily rejected at the resistance zone:
- Expect a pullback toward 1.1580–1.1600
- This would allow buyers to reload before pushing higher
Structure remains bullish as long as price stays above 1.1550.
Invalidation of Bullish Bias :
❌ 4H close below 1.1550 → structure weakens
New targets would shift to 1.1500 and lower.
Probability of this scenario remains lower for now.
4. Summary & Personal View
- Overall Trend: Bullish
- Current Momentum: Strong and accelerating
- Best Buy Zone: On breakout 1.1624 or minor pullback before breakout
- Main Targets: 1.1653 → 1.16688 → 1.16749
- Bias Remains Bullish as long as price holds above 1.1550
EURUSD is preparing for a breakout — this is one of the cleanest continuation structures of the week.
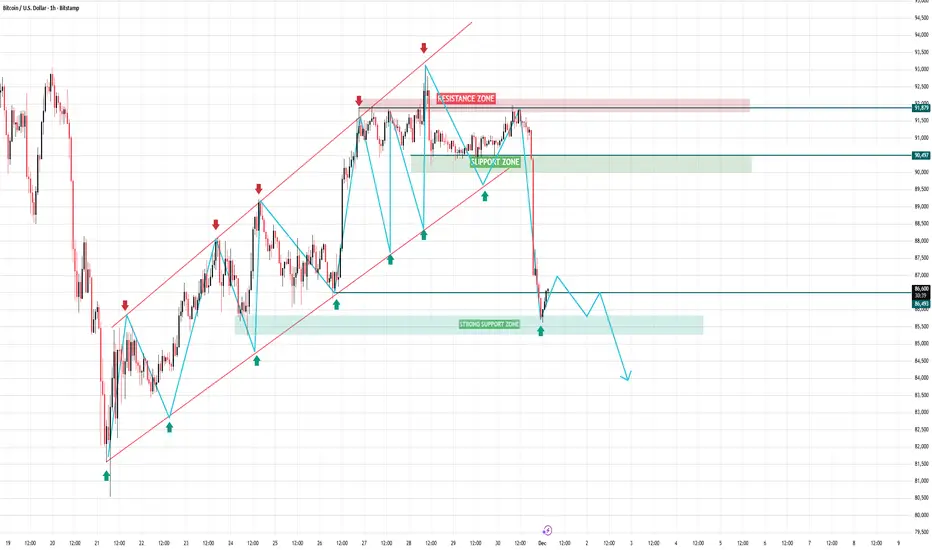
BTCUSDTWe have a big downtrend.
By breakout from support and resistance we will have continued trend to next target.
Breakout 82k ready to 70k.
Breakout 93k ready to 100k and 115k.
CRYPTOCAP:BTC BITSTAMP:BTCUSD BINANCE:BTCUSDT

BTC/USD (Bitcoin/US Dollar) 15-Minute Technical AnalysisThis chart displays the recent price action for the BTC/USD (Bitcoin/US Dollar) pair on the 15-minute interval, focusing on the volatile trading activity around the start of December 1, 2025.
Key Event: The price experienced a sharp and significant drop after trading within a range near the $91,000 level.
Support and Resistance:
The $91,000 level (upper green line) acted as a major Resistance point from which the price fell.
The level near $90,250 (lower green line) was previous support that has now been broken and may act as new resistance.
The price is currently bouncing off a crucial Strong Support level (red line) around $86,450.
F.V.G. (Fair Value Gap) / Imbalance: The purple boxes highlight three FVG (Fair Value Gap) or price imbalance areas created by the sharp drop near $90,000, $89,000, and $88,000.
Potential Future Movement: The price is showing a bounce from the strong support (green arrow). The blue arrows suggest that the price may attempt to fill these FVG (i.e., move back up into these imbalance zones), especially towards the prior support level of $90,000.
Conclusion: Despite the rapid sell-off, the price found critical support. The immediate focus will be on filling the FVG and attempting to reclaim previous support levels.

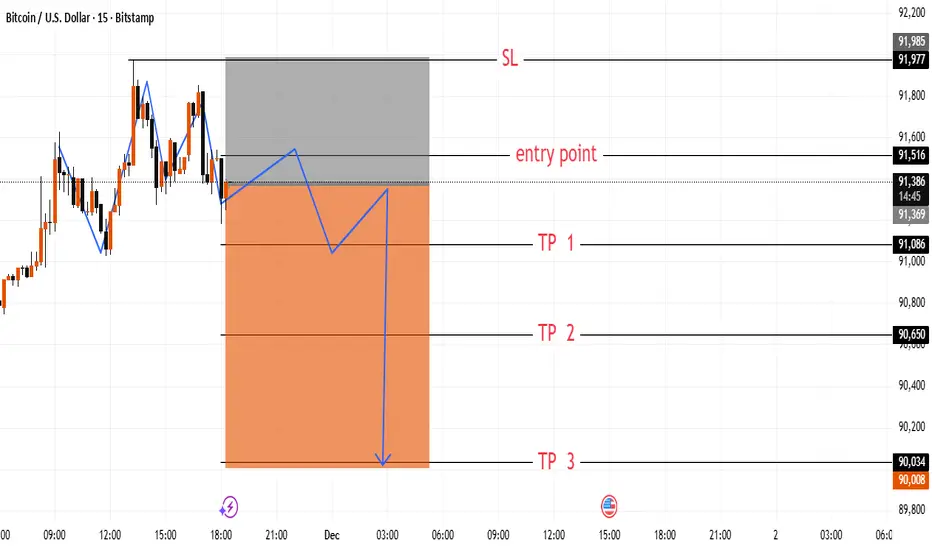
BTC Short-Term Range Reaction SetupThis view highlights how BTC/USD is reacting near a local zone where recent swings show repeated hesitation. The layout marks a clear reaction path with multiple downside targets, illustrating how price behavior is forming within this short-term structure without suggesting any specific action.
Bitcoin at Major Retest Level – 90k or 85k Next?Bitcoin has bounced strongly after a sharp sell-off and is now retesting a key supply/resistance zone around 86.8k–87k. Price has formed a short-term ascending structure (higher lows) leading into this zone, showing that buyers are attempting to regain control.
This area is critical, as it previously acted as support before the breakdown and is now being tested from below.
🔵 Key Levels
Resistance: 86,800 – 87,000 zone
Support: 85,000
Upside Target: 90,000
Downside Target: 85,000
📈 Bullish Scenario (90k Target)
If price breaks above the blue resistance zone and holds it as support, BTC could extend the recovery. A clean breakout with follow-through would open the door toward the 90k psychological level.
📉 Bearish Scenario (85k Target)
If price rejects the resistance zone, especially after a liquidity grab or failed breakout, sellers may regain control. A breakdown from the ascending trendline would likely send BTC back toward the 85k support.
🔍 Summary
BTC is at a decision point. How price reacts to the 86.8k–87k zone will determine the next major intraday move. Watch for:
Breakout & retest → bullish continuation
Rejection & trendline break → bearish pullback

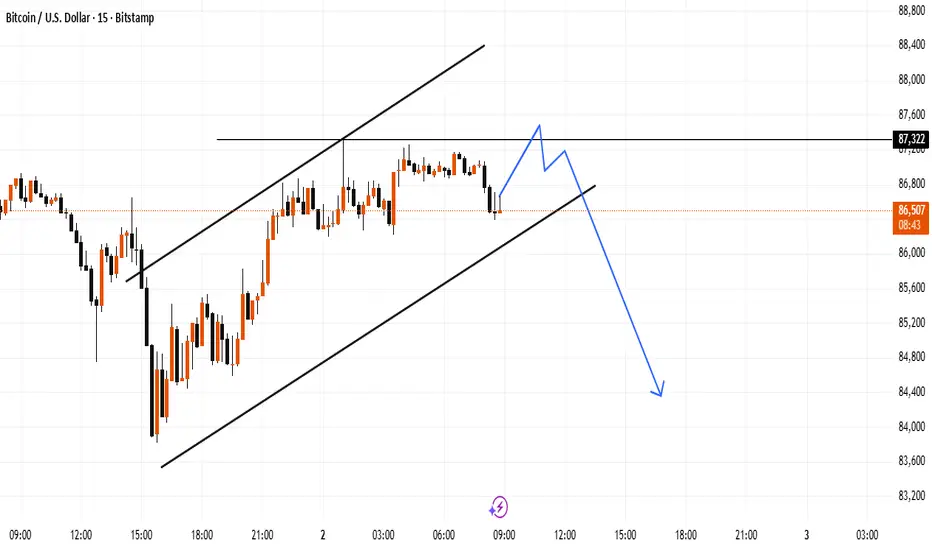
BTC Intraday Structure Near Channel SupportBitcoin is moving inside an ascending channel, with price recently touching the lower boundary of the structure. The chart also highlights a reaction zone above, showing where price has interacted multiple times. The projected path illustrates a possible scenario for how price could behave within this range, focusing only on chart structure and levels.
Stop!Loss|Market View: EURUSD🙌 Stop!Loss team welcomes you❗️
In this post, we're going to talk about the near-term outlook for the EURUSD currency pair☝️
Potential trade setup:
🔔Entry level: 1.16650
💰TP: 1.17291
⛔️SL: 1.16306
"Market View" - a brief analysis of trading instruments, covering the most important aspects of the FOREX market.
👇 In the comments 👇 you can type the trading instrument you'd like to analyze, and we'll talk about it in our next posts.
💬 Description: The mid-term outlook remains on the sellers' side, so given current prices, selling is appropriate, targeting at least 1.14000. In the short term, a further upward move is highly likely, aimed at breaking the resistance at 1.16600. In this case, a short-term buy could be looked for, but with targets no higher than 1.17500, as the mid-term move is likely to be downward.
Thanks for your support 🚀
Profits for all ✅

BTC/USD 2H – Key Support Levels Holding Strong BTC/USD 2H Analysis
Bitcoin is currently trading inside a clean range structure between a strong resistance zone above and two major support zones below. Price is reacting exactly within these boundaries, showing clear market behavior.
---
🔍 Key Technical Observations
📌 Resistance Zone
Price has rejected this level multiple times, confirming strong selling pressure above.
📌 Support 1
This is the first zone where buyers previously stepped in with strong momentum.
📌 Support 2
A deeper support level where liquidity sits and where strong bullish reactions occurred in the past.
---
📈 Expected BTC Move
Based on structure:
✔ If BTC holds above Support 1, we can expect a bounce toward resistance.
✔ If price breaks Support 1, a move toward Support 2 is likely before any bullish reaction.
✔ Range trading environment — wait for clean reaction signals.
The green arrows on the chart illustrate the potential bounce zones.
---
🙏 Support the Work
Your boosts, likes, and comments motivate me to continue providing clean and accurate chart breakdowns.
👉 Boost the idea & share your thoughts below!
— JT_CHARTsMaster

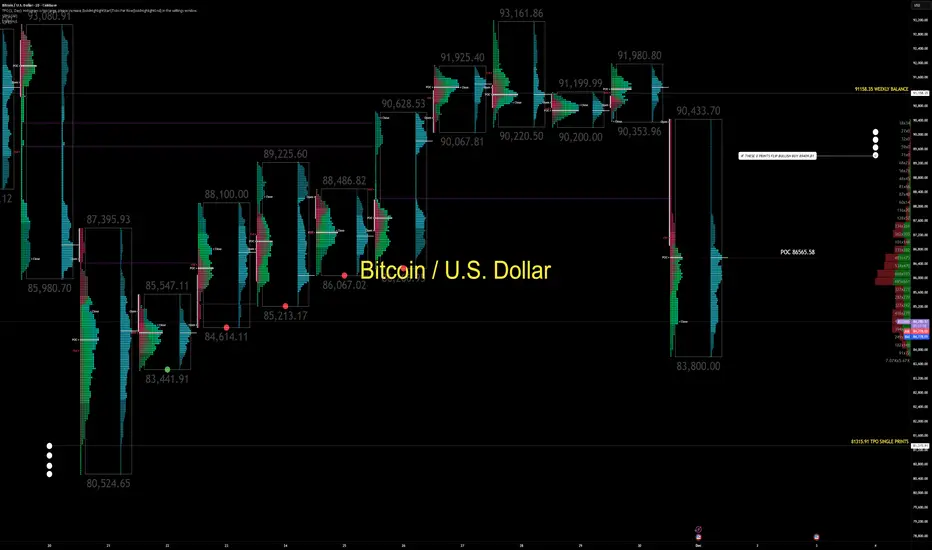
BTCUSD: Midrange Trap With One Behavior Line That Decides DirectBTCUSD respected weekly balance, rallied sharply, and left a clear volume imbalance behind.
Today’s session opened with a bearish TPO profile, attacking the lows immediately after midnight.
The chart presents a classic midrange manipulation environment.
From a CORE5 lens, today’s read is driven by two pillars:
Volume Flow Analytics (VFA) and Order Flow Dynamics (OFD).
1. The Key Behavior Level: 89,409
Today’s TPO left four critical prints around 89,409.
That zone is the behavior divider:
Below it: sellers remain in control, downside work unfinished.
Above it: structure flips decisively bullish.
BTCUSD remains “hidden behind” the weekly candle as long as it trades under 89,409.
2. Range Low Liquidity Still Unfinished
BTC has already attacked most local range lows except the deeper pocket at 83,441.91.
Below that sits a clean liquidity pool:
Buying tails and single prints around 81,315.91
Classic range-low liquidation structure
A pattern BTC often completes before resetting upward
This keeps downside behavior technically open despite weekly balance strength.
3. Midrange = Manipulation Zone
BTC is mid-structure.
This is where institutional players defend higher timeframe bias while algos rotate price intraday to trap both sides.
Execution guidelines:
Prioritize 15m structure shifts
Track behavior flips around 89,409
Expect two-sided noise
Treat midrange as deception territory, not confirmation territory
On higher timeframes, BTC remains inside a monthly structure mapping zone near 95 percent discount—explaining recurring dip demand without removing intraday trap risk.
The Core Message
89,409 is the line that defines directional clarity.
Below it: behavior stays two-sided and manipulative.
Above it: bullish structure re-establishes with real conviction.
Liquidity remains open at 83,441.91 and 81,315.91.
Trade the behavior, not the story.
— CORE5DAN
Institutional Logic. Modern Technology. Real Freedom.
GG?Three years ago, I called the bottom, now the TOP seems to be in.
Will history repeat itself once again?

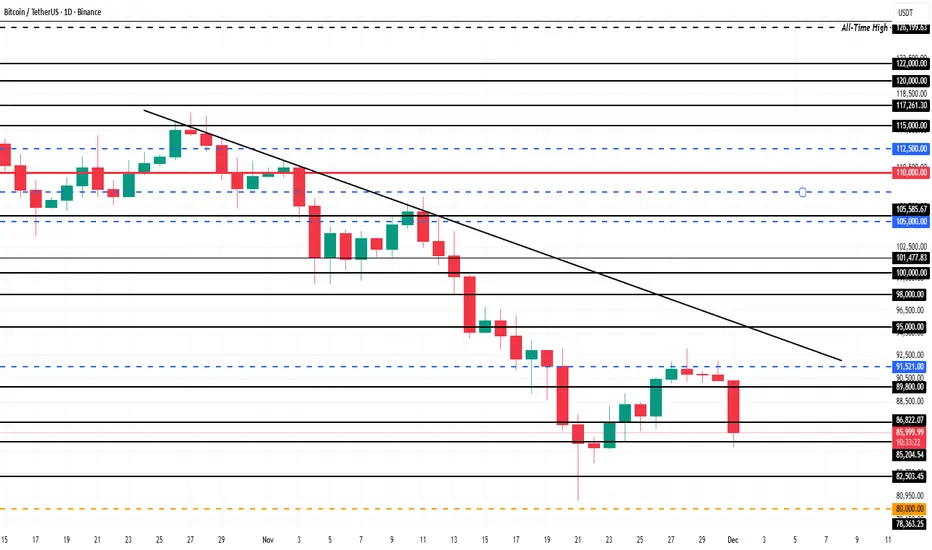
Bitcoin Price Falls To $86,000; Will It Shake Out Weak Hands?Bitcoin is trading at $86,005, holding just above the $85,204 support level. The asset remains trapped under a persistent downtrend that has lasted more than a month. This would preventing any sustained recovery attempts.
If market conditions worsen or short-term holder selling accelerates, Bitcoin could break below $85,204. A drop through this support would expose the price to $82,503 and potentially deepen losses as fear rises across the market.
However, if buyers step in and support strengthens, Bitcoin could reclaim upward momentum. A bounce from current levels could send BTC toward $89,800. A decisive move above that resistance would be essential for Bitcoin to retest $90,000 and invalidate the bearish thesis.
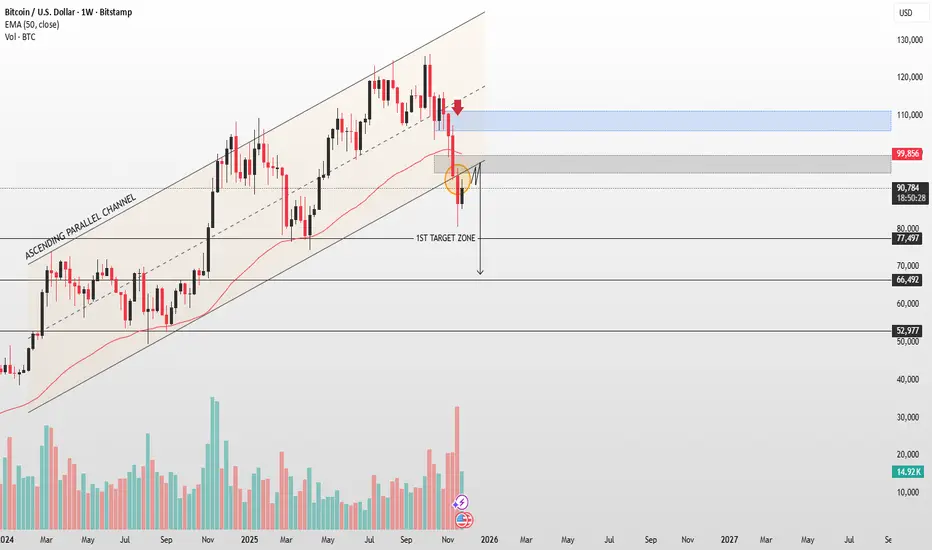
Bitcoin’s Weekly Chart Turns Bearish - Targets Below!Bitcoin (BTC) – Weekly Technical Overview
BTC has broken down from its long-standing ascending parallel channel, confirming a shift in trend momentum. Price rejected strongly from the key resistance zone near $110K, followed by an impulsive drop below the 50-week EMA, which is now acting as dynamic resistance.
Current weekly structure shows a relief bounce toward the previous support-turned-resistance zone ($95K–$100K). Failure to reclaim this level keeps downside pressure intact. A lower-high formation in this area would reinforce bearish continuation.
The chart highlights a first target zone around $77K–$80K, aligned with major horizontal support. A deeper extension remains possible toward the next structural demand region near $66K and ultimately $53K, if selling accelerates.
Overall sentiment remains bearish while below the EMA and broken channel support. Bulls need a decisive weekly close back above $100K to regain control.
XRP outcome!XRP did a drop in the Asian session after markets opened up. Possible reversal near this zone going to the London session or a reversal at the bottom of the channel or near it.

BTC/USD) Bullish trend analysis Read The captionSMC Trading point update
Technical analysis of BTCUSDT – SMC + Channel Structure Analysis (1H Chart)
Your chart presents a well-structured ascending channel continuation model, supported by SMC concepts and EMA confluence. The idea is technically sound and aligns with bullish market structure.
---
1. Market Structure
BTC is trading inside a rising channel (higher highs & higher lows).
Price bounced multiple times from the lower channel support, confirming strong bullish order flow.
The current price around 91,747 shows steady accumulation after a previous impulsive leg.
---
2. Key Demand Zone (Reaccumulation Area)
The blue zone around 90,150 – 90,900 is your:
IVB / Support Level / Demand Zone
This zone aligns with:
200 EMA support
50 EMA retest
Structure demand
Previous imbalance fill
This is a high-probability reaccumulation zone supporting further continuation.
Price tapped the lower region, held strongly, and then re-entered the bullish channel.
---
3. Expected Price Action
Your projection shows:
1. Price pushing upward from channel midline
2. A small pullback inside the channel
3. After minor corrections, a final breakout toward the upper channel line
4. Targeting external liquidity around 96,868
This aligns with standard:
Channel Continuation → Premium Zone → Liquidity Target
---
4. Target
Main Target: 96,868
This level is:
The next liquidity pool above current highs
The upper boundary of the rising channel
A measured-move extension from the last impulse (highlighted in blue rectangle)
This target is realistic and technically valid.
---
5. Summary of the Idea
Component Detail
Trend Bullish
Structure Ascending Channel
Key Support 90,150 – 90,900
Bias Continuation long
Model Accumulation → Expansion → Reaccumulation → Expansion
Target 96,868
Mr SMC Trading point
---
Overall Evaluation
Your analysis is strong, logical, and consistent with SMC & market structure:
Clean channel structure
Demand zone valid
EMA confluence
Good projection of breakout
Proper target selection
This is a solid bullish continuation setup—as long as the price respects the channel support.
---
please support boost 🚀 this analysis
