A descending channel/bullflag reveals itself on btcusdThe pole looks more obvious on longer timeframe charts but the flag/ channel itself is best illustrated on the 1day time frame. In fact there is a much longer pole than the one shown here on the monthly chart, but I didn’t go with that one because the flag on the monthly is more of a horizontal channel than the descending channel shown here on the 1day chart. *not financial advice*
1daychart

BNB/USD 1D Chart Review UpTrend1. Trend Structure
The price was in a long-term uptrend (marked by the orange lines).
The last breakout occurred at the top of this channel, which is a strong signal of trend continuation.
A breakout from the channel usually means that the market is gaining additional momentum – not only maintaining the current growth rate, but even accelerating it.
2. Breakout Range
The height of the channel (the difference between the lower and upper orange lines) is approximately ~$300–$320.
It is assumed that after breaking out of the channel, the price can cover a distance equal to its height.
This indicates a potential target around:
$1,100–$1,150 (the first key resistance level, aligned with the green zone on the chart).
The next range is as high as $1,280–$1,300 (the upper level marked by the green line).
3. Key Technical Levels
Support (red lines):
USD 899
USD 775
USD 702
These levels are most important for potential corrections.
Resistance (green lines):
USD 1,116 (nearest target after the breakout)
USD 1,280–1,300 (full range of the channel height)
4. Oscillators and Momentum
Stoch RSI (at the bottom of the chart): heavily overbought, which may suggest a short-term correction before further upward movement.
In uptrends, overbought levels do not always lead to large declines – often only to sideways consolidation.
5. Scenarios
Bullish:
Price remains above USD 900, consolidates, and then tests USD 1,116, with a target of USD 1,280–1,300.
Bearish:
If the market fails to maintain the breakout and returns below $900, a return to the middle of the channel to the $775–$800 area is possible.
✅ Summary:
A breakout from the channel to the upside is a very positive signal, and the technical upside range reaches $1,100–$1,300. However, due to the overbought position (Stoch RSI), a correction or short-term consolidation is possible before the price continues towards the full target.

Near moving above invh&s w/ a double bottom neckline just aboveThe inverse head and shoulders breakout not yet fully confirmed, but price is currently comfortably above its neckline. In hitting the inverse head and shoulders full target, it should also validate the double bottom breakout as well. *not financial advice*

XRPUSD 1D chart review1. Trend and lines
• We had a clear downward trend (orange trend falling line).
• The price broke this line and came out of the top - this is usually a signal of changing the sentiment to a more bullish.
2. Support and resistance
• The next support: approx. 2,93–2.92 USD (Red Zone + SMA).
• Another strong support: approx. USD 2.76 (below, heavily tested earlier).
• The nearest resistance: approx. USD 3.12 (green line).
• Another resistance above: approx. 3,35-3.36 USD - very important, because breaking this level can open the road to $ 3.50 and higher.
3. Medium walking (SMA)
• Red SMA (shorter) slowly turns up.
• Green SMA (longer) is still slightly inheritance, but the price is already lasting.
• This is a positive signal - the beginning of the trend change may suggest.
4. MacD (at the bottom of the chart)
• The blue line (MacD) cut the orange (Signal) from below - this is a buy signal.
• The histogram begins to grow green → Momentum tilts to the bull side.
5. RSI
• RSI is around 55–60, i.e. in the neutral zone, not yet noticed.
• There is a place for further growth before it enters the purchase zone (> 70).
⸻
✅ Summary for you (straight)
• Breaking the inheritance trend, buy signal on MacD, RSI not too high yet.
• Key resistance now: USD 3.12 → If it pierces, the target is USD 3.35.
• Key support: USD 2.92 → If it drops below, possible exit to USD 2.76.

ETCUSDT 1D chart reviewTrend and structure
• The price is currently in the 20.40 USDT area.
• You can see the downward trend line (orange), from which the price was rejected several times.
• The next support:
• 20.40 USDT (local, just tested)
• 19.01 USDT (stronger support from earlier holes).
• The nearest resistance:
• 21.09 USDT (SMA + local level)
• 22.64 USDT (strong resistance, last peak before fall).
Medium walking
• SMA (red/green lines) show that the short -term price is below most of the average → supply advantage.
• Only breaking above 21.1–22.6 USDT could change the fondness for more bullfinches.
MacD
• The histogram grows slightly up (less red), but MacD lines and signal are close to each other → no clear trend, rather consolidation with slight relegation.
RSI
• RSI around 45–50, i.e. neutral.
• There is neither a sale (<30) nor purchase (> 70).
⸻
📊 scenario
• bull:
If ETC persists above 20.40 and boots over 21.1 USDT, it is possible to move in the direction of 22.6 USDT (main barrier).
• Bear:
If the price drops below 20.4 USDT, another goal is 19.0 USDT. Punction of 19 could open the road even towards 18-17.5 USDT.

LTCUSDT 1D chart review🔎 key levels
• Resistance resistance:
• 118.92 USDT (local resistance, recently tested several times).
• 126.05 USDT (stronger resistance - if it pierces, the trend is continued).
• Support (Support):
• 113.31 USDT (current level, currently defended).
• 109.28 USDT (SMA as dynamic support).
• 102.38 USDT (key support - if it falls, there may be a stronger decrease).
⸻
📉 Trend
• You can see the yellow inheritance trend line on the chart - the course respected it several times.
• Currently, the price is trying to stay above SMA200 (green line), which is a signal of a potential reflection.
⸻
📊 indicators
• MacD:
• The histogram has gone into a positive zone, which suggests growth moment, but the signal lines are close to each other → possible consolidation.
• RSI:
• Value around 50 → neutral zone, no clear purchase or sale.
• If he pierces 60, he may enter the upward trend.
⸻
📌 Scenarios
1. Bullish
• If it stays above 113.31 and breaks 118.92, the goal will be 126 USDT.
• Confirmation: RSI> 60 and MacD further opening up.
2. Bearish
• If the course drops below 113.31, subsequent support is 109.28 and 102.38.
• Confirmation: Macd Cross down + RSI <45.

XRPETH chart heading to it’s next breakout targetI do think eth will be making decent gains here in the near future, but t looks like xrp will outpace those gains with its own gains based on the current chart pattern on the XRPETH chart. *not financial advice*

ETH/USDT 1D chart review🔎 Technical analysis
1. Trend
• You can see a clear growth trend line (orange). The price consistently reflected from her, which means that the buyers defend this level.
• Currently, the price is above trendline, which is a bull signal.
2. Support and resistance
• Support:
• $ 4,429
• USDT $ 4,556
• resistance:
• $ 4.687 USDT (current price fight - this is where the market is testing)
• USD 4,793 (strong resistance)
• USD 4,954 (key psychological resistance - nearly 5K)
3. Candles
• We have a long green up move - the momentum is strong.
• The last candles show a little indecisive at 4.687 (upper shadows), i.e. possible consolidation or back.
4. STOCHASTIC RSI (oscillator at the bottom of the chart)
• enters the purchase zone (> 80).
• This often heralds correction, but in strong trends the indicator can last long.
⸻
📊 Scenarios
• bull (continuation of growth):
If ETH stays above 4.687 and pierces 4.793, the next goal is 4.954 (and then psychological 5,000).
• Bear (correction):
Rejection 4.687 and descent below 4.556 can open the way to the Trendline test around 4.430.
Puncting the trend down is a reversal signal and a possible drop towards 4.200.
⸻
📌 Summary
• Main trend: upward.
• Momentum: Strong, but the indicators show buying.
• Strategy:
• Careful entrances with support (4.556 / 4.430).
• confirmed breaking 4.793 = strong signal for further increases.
• Stop loss below Trendline (~ 4,400), because it will negate the current script of the bull

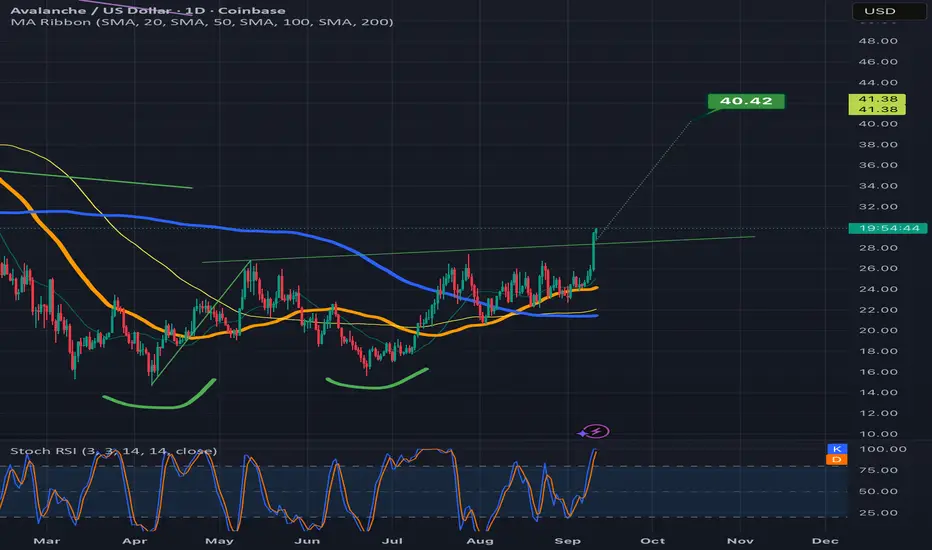
Avalanche with a close above the double bottom necklineNot sure whether it will validate the breakout here or go back below the neckline, but that was a very convincing bullish candle close above the neckline on the previous daily candle so it should give it some reasonable probability. *not financial advice*
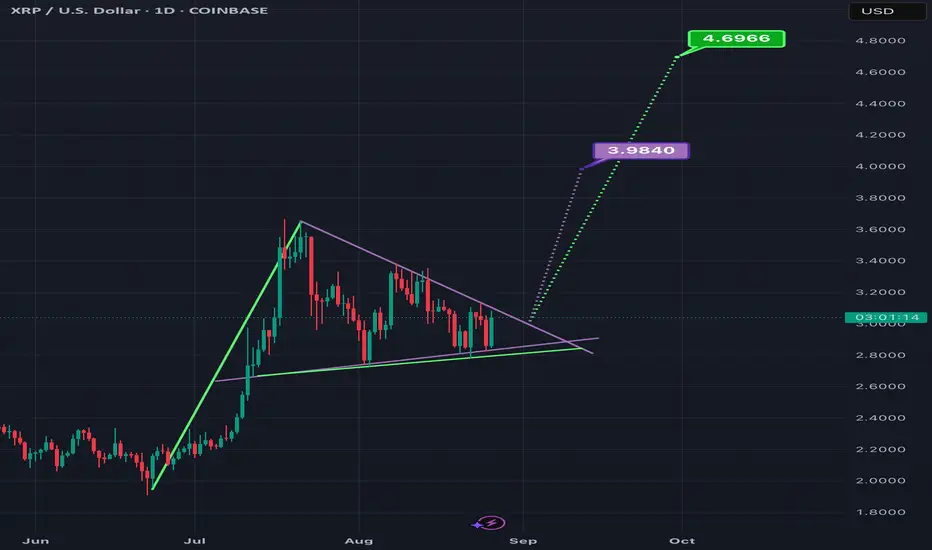
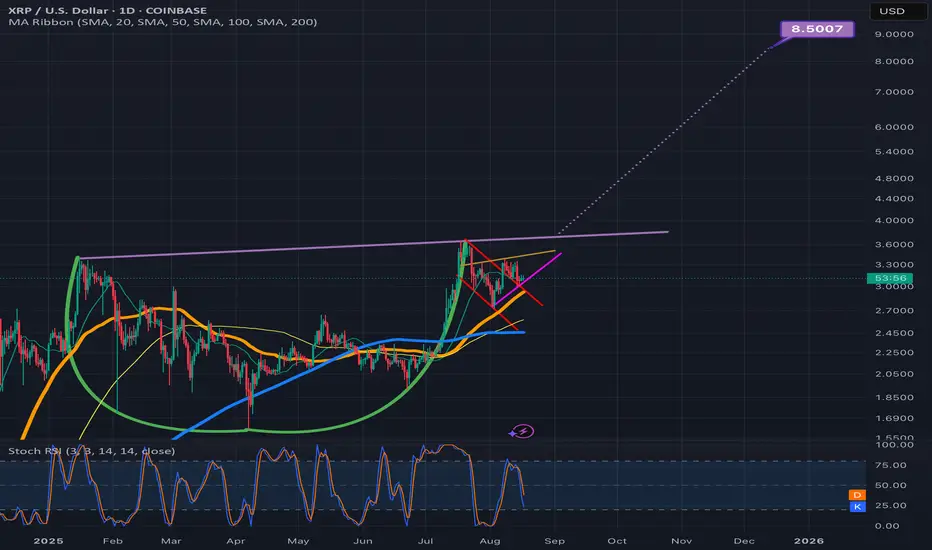
1day xrp bullish pennantHard to tell which of these trendlines is the most valid top trendline and bottom trendline of this triangle/pennant so I have to include them all since any can potentially be. *not financial advice*

XRP/USD 1D Chart ReviewFormation
The chart shows a narrowing symmetrical triangle (orange lines).
The price is now in the lower part of the triangle, with support around $2.80–2.79.
If the price breaks out of this consolidation, we could see a larger trend move.
Supports
$2.80–2.79 – local support (lower line of the triangle).
$2.63 – strong horizontal support, reinforced by the earlier rebound.
$2.46 (SMA200) – key intermediate-term level.
Resistances
$3.00–3.08 (SMA50) – first major resistance.
$3.17 – next barrier.
$3.42 – strong resistance from July.
Indicators
MACD: below the 0 line, negative histogram → bearish signal, but no strong downward momentum yet.
RSI (41): close to the oversold zone, but still neutral-weak – no clear divergence.
SMA50 (red) is falling and is above the price → selling pressure.
SMA200 (blue) is rising and acting as medium-term support.
Scenarios
Bullish – a rebound from the lower boundary of the triangle (2.80) and an attack on $3.00–3.08. A breakout from the upper boundary of the formation will open the way to $3.42.
Bearish – a breakout below the $2.80–2.79 zone → a test of $2.63 and deeper into $2.46 (SMA200).
Summary
The market is at a critical juncture – price is squeezed within the triangle, indicators are neutral-weak, and volume is decreasing. A breakout from this consolidation (most likely in early September) will set the course for the next move.
👉 If you're trading short term, maintaining the $2.80 level is key.
👉 If you're trading medium/long term, only a break above $3.08–3.17 will provide a strong bullish signal.

BTCUSD 1D Chart1. Price Trend and Structure
The BTC price has fallen below the yellow uptrend line – this indicates a break in the bullish structure and signals weakening buyers.
Currently, the price is hovering around $107,950, which is local support (red zone ~108k).
Next important supports:
$104,500 – $103,900
$98,400 (recent stronger demand level + near the 200 SMA).
Resistance to break:
$113,500 (green line, previous support now acts as resistance).
$118,000 (key level for a return to the uptrend).
$124,500 (highs).
2. Moving Averages
SMA 50 (green) and SMA 200 (blue) → classic trend analysis:
The price is currently below the SMA 50, confirming short-term weakness.
The SMA 200 (~$100,300) is still maintaining the long-term trend – only a break below would signal a more serious bear market.
Possible scenario: If the SMA 50 begins to decline and approaches the SMA 200 → a Death Cross threatens.
3. MACD
Negative histogram, signal line below zero → downward momentum continues.
No signs of a reversal (no positive divergence yet).
4. RSI
RSI ~47 – neutral zone, slightly below 50 → not oversold, but showing an oversold market.
The RSI previously rebounded from the ~70 line (overheating) and is now heading down.
5. Key Levels
Support:
108,000 (current)
104,500
98,400 (strategic)
Resistance:
113,500
118,000
124,500
📊 Scenarios
Bearish (more likely now):
If 108,000 fails → a test of 104,500, and in the longer term, 98,400 USD.
A break below 98,000 would signal a long-term downtrend.
Bullish (less likely at this point):
A return above 113,500 and a daily candle closing above this level → a signal for a reversal and a possible re-entry into the 118–124k range.

Symmetrical Triangle/ Bull Pennant on XRPUSD Nearing its ApexThe bottom trendline of this triangle definitely seems to have finally been narrowed down to this purple line and green line with multiple touch points to back that up. *not financial advice*
AVAX/USDT 1D ChartCurrently 25.86 USDT (+2.42%).
• The price has reflected from support around 22.6 USDT and broke over SMA (average walking).
• You can see an attempt to continue the upward trend - local "mini bull run".
⸻
2. Support and resistance
• Support:
• 24.39 USDT (SMA #1, short -term support).
• 22.60 USDT (strong support - earlier level of consolidation).
• 20.20 USDT (key hole below which the downward trend returns).
• resistance:
• 26.26 USDT (local resistance, currently tested).
• 27.72 USDT (another strong level of resistance).
• 30.95 USDT (key resistance - return to a strong supply zone).
⸻
3. Medium walking (SMA)
• The price was pierced by SMA #1 (red) and SMA #2 (green).
• SMA #5 (blue) is located lower (~ 22.5), which shows that the short -term trend is now stronger than the long -term → bull signal.
⸻
4. MacD
• The histogram begins to grow above line 0.
• The MacD line cut the signal line from the bottom → buy signal.
• The growth moment is developing.
⸻
5. RSI
• RSI ~ 58 → neutral, but close to the "bull" zone.
• Not yet bought out (> 70), so there is space for further increases.

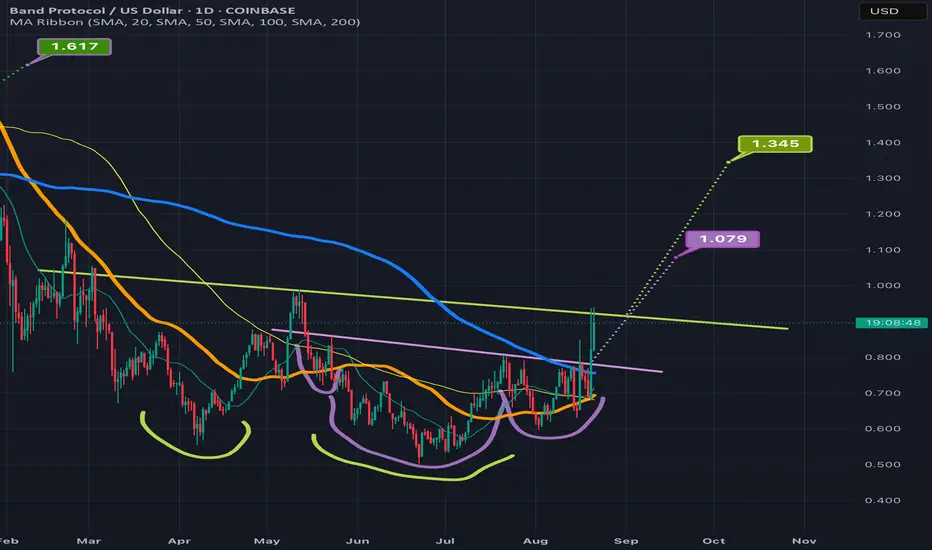
BANDUSD attempting an invh&s + double bottom breakoutBAND has been available for a significant iscount lately but the sale may be ending soon as it is now attempting both an inverse head & shoulders breakout, as well as sending wicks above the neckline of a slightly larger double bottom pattern. The double bottom pattern is in chartreuse and the inverse head and shoulder pattern is in lilac. We can also see BAND looks lke it’s about to have a golden cros in the next week or 2 which should increase probability to confirm the breakout of these two bullish patterns as it will add bullish confluence as long as prce action isn’t two high above the 30&200 moving averages at the time of the golden cross *not financial advice*
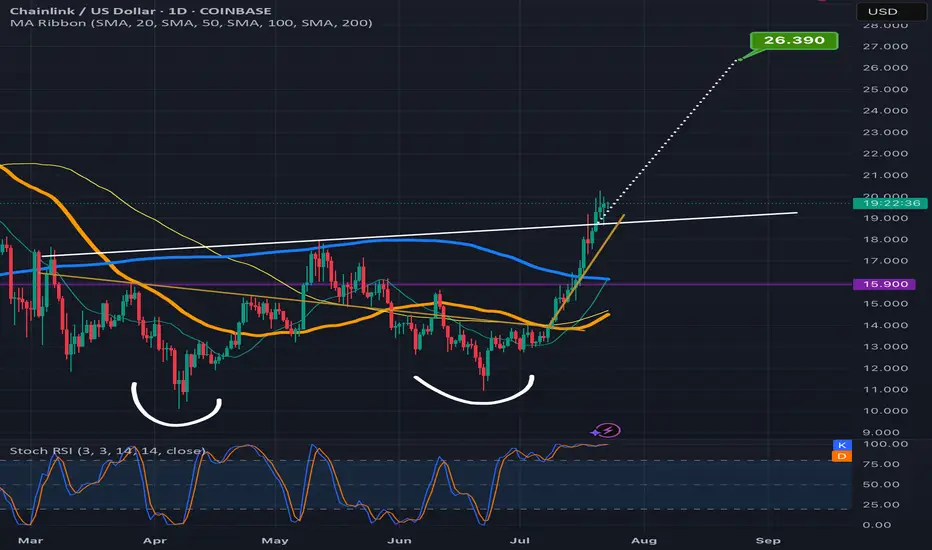
Chainlink looks ready 2 break up from bullflag & a double bottomGreen target is the bullflag white target is the double bottom. *not financial advice*
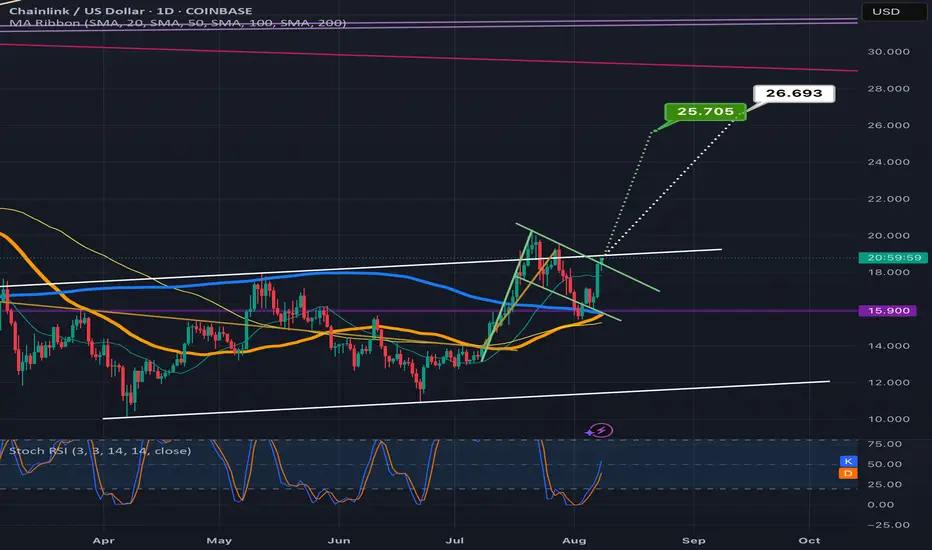
Chainlink climbing the measured move line staircaseLooks like Chanlink is ready to confirm the double bottom breakout here as the past few candles have already started to climb up the measured move line like a staircase.Always possible for a dip back below the neckline at this point but probability slightly favors the readout being validated instead for now. *not financial advice*
Log chart c&h patternThis one has an $8.50 target. This is the daily time frame, logarithmic scale. *not financial advice*
BNB/USDT 1DTrend and market structure
• The price moves in an upward trend from the hole around 730 USDT, maintaining support on the trend line (orange line).
• Current price: ~ 840 USDT, close to important resistance at ~ 862 USDT.
• Another strong resistance is located at 940–950 USDT.
• The next support is 809 USDT (local horizontal level) and 758 USDT (earlier hole).
⸻
Medium walking (SMA)
• SMA #1 (red) is below the price - this is a growth signal.
• SMA #2 (green, long -term) is also below and inclined up - confirms the upward trend.
• SMA #5 (blue, very long) is far below - the market is still in the growth phase.
⸻
Indicators
• MacD - MacD line pierces the signal line from below, which is a buy signal. The histogram is slightly positive.
• RSI - ~ 66 points, grows towards the purchase zone (70). There is no extreme yet, but it is approaching - the risk of correction after breaking the resistance.
⸻
• (more likely with current dynamics): breaking the level of 862 USDT and continuation in the direction of 940 USDT. There are more profit realizations possible here.
• Bear: rejection from resistance and decrease in the direction of 809 USDT or even a trend line test and level 758 USDT.

ETC/USDT 1D Chart1. Trend and price structure
• The price is currently 23.71 USDT (+6.75% on the day).
• After an earlier inheritance trend (yellow dotted line - trend line), you can see an attempt to break up and maintain above SMA 1 (approx. 22.30 USDT).
• The next resistance is 24.50 and 26.00 USDT - you can see that the supply of supply was already 24.50.
• The next support is 22.30 and stronger at 21.02 USDT.
2. Medium walking (SMA)
• SMA #1 (red) - short -term, the price is above, which is a bull signal.
• SMA #2 (green) - medium -term, also below the current price, which supports the upward scenario.
• SMA #5 (blue) - long -term, is lower (approx. 18.85), so the main trend is not completely inverted yet, but the momentum is growing.
3. MacD
• The MacD line pierced the signal line from the bottom - buy signal.
• The histogram has gone down in positive values - the growing pressure of buyers.
4. RSI
• RSI around 55–60 - far from the purchase zone (70+), so theoretically there is still space for growth.
• RSI has pierced its average, which is confirmed by bull's sentiment.
5. Scenarios
• Bull: Maintenance of a price above 22.30 and a possible retest 24.50 with an attempt to break in the direction of 26.00. At 26.00 - road to 27.00–28.00.
• Bear: a decrease below 22.30 opens the road to 21.02, and a deeper descent - around 19.80 or 18.85.
6. Applications
• Short -term - advantage of buyers, but strong resistance at 24.50.
• A good moment for swing traders to watch the reaction at 24.50.
• For long -term positions - full confirmation of the trend reversal only after 26.00.

BTC/USD 1D1. Price Structure and Patterns
Medium-Term Trend: Since mid-June, the price has been consolidating between ~$112,000 and ~$121,000, but with a slight upward slope.
Upward Channel: Marked with orange lines – the current candlestick is near the top of this channel.
Triangle Breakout: The white dashed line indicates an upward breakout from the converging triangle (symmetrical) formation, which could signal continued growth.
2. Support and Resistance Levels
Nearest Support:
USD 117,009 (Fib. Level 0.236 and local low)
USD 115,912 (SMA200 – red line)
USD 112,167 (lower consolidation boundary and prior support)
Nearest Resistance:
USD 121,151 (Fib. Level 0.382)
USD 123,966 (Fib. Level 0.5 – key psychological and technical resistance)
USD 126,781 (Fib. Level 0.618 – strong resistance)
USD 130,788 (Fib. Level 0.786 – breakout target)
3. Technical Indicators
MACD: The MACD line is beginning to intersect with the upside signal line – suggesting the beginning of upward momentum.
RSI: 59 – rising, but not yet in the overbought zone (above 70). This means there is room for further growth.
Moving Averages:
The SMA50 (~$114,020) and SMA200 (~$115,912) are below the price – a bullish pattern.
The price has rebounded from the SMA50, which is often a good starting point for further growth.
4. Scenarios
Bullish (more likely at this point)
If the price holds above $118,000 and breaks $121,151, a quick move to $123,966 and then $126,781 is possible.
Confirmation – the daily candle closes above $121,151 on increasing volume.
Bearish
If the price falls below $117,000, a retest of $115,912 is possible, followed by $112,167.
A break of $112,167 could signal a downtrend reversal.
5. Key Observations
Volume is increasing on bullish candles → a sign of accumulation.
The price is near strong resistance at $121,000–$122,000 – a correction is possible here.
Longer term (Fib from the March low), there is potential for a move towards $130,000–$135,000 if the trend continues.

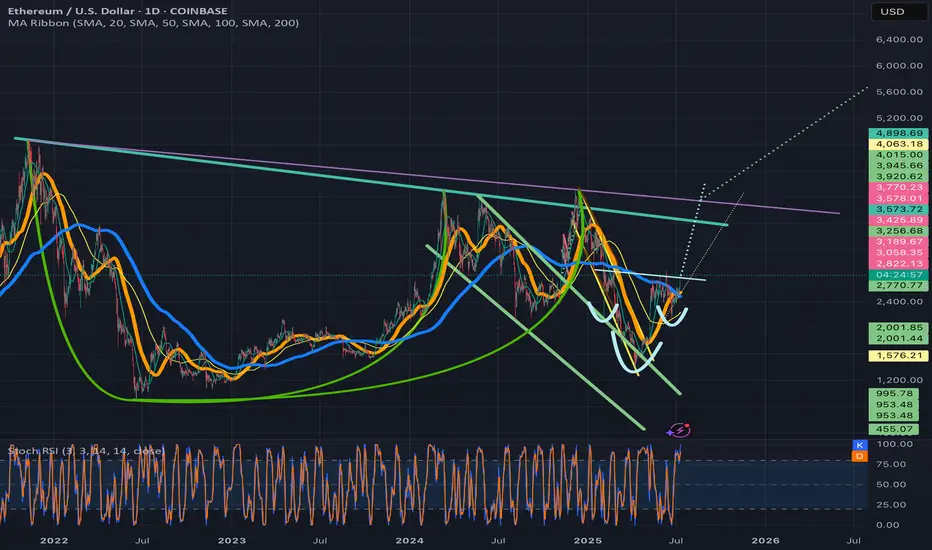
Ethusd breaking above invh&sEthusd chart has a similar set upas the total2 chart, a cup and handle that is breaking up from a smaller inverse head and shoulders that will complete the handle to the cup. Ethereum actually has two potential to trendlines for its cup and handle and I wouldn’t be surprised if both are valid. The breakout target for the inverse head and shoulder pattern will take price action above both of them. Once we solidify the top trendline for the cup and handle patterns as support the breakout target for it is $7161. Ethereum just recently had a golden cross on the daily which adds to the probability the inverse head and shoulder pattern breakout will be validated. *not financial advice*
Chainlink (LINK/USDT) from 1D interval📈 Trend and Market Structure
Current trend: Upward (higher lows and highs)
The price is moving within an ascending price channel, marked by two black trend lines.
The recent rebound occurred from support around 14.83 USDT, which coincides with the lower boundary of the channel.
🔍 Key Levels
✅ Resistance (green horizontal lines)
18.98 USDT – local high
21.16 USDT – main resistance, possible target after breaking $19
18.27 USDT – current local resistance zone, currently being tested
17.62 USDT – mid-range resistance
🛑 Support (red horizontal lines)
15.97 USDT – first local support
14.83 USDT – important support (price reaction, trend confirmation)
13.30–13.50 USDT – key demand zone
12.50 USDT – lower historical support
📊 Indicators
🔄 Stochastic RSI
%K and %D lines cross from below → buy signal
Currently emerging from oversold levels (< 20), which could indicate a continuation Growth
📉 MACD
The histogram is decreasing, but the rate of decline is slowing.
Possible buy signal if the MACD line crosses the signal line from below.
🔊 Volume
Increasing volume during gains, lower volume during corrections – confirms bullish strength.
The recent decrease in volume may indicate consolidation or preparation for the next move.
📌 Scenarios
🟢 Bullish Scenario:
Uptrend maintained within the channel.
Breakout above 18.27 and 18.98 → possible rally to 21.16.
Confirmation by MACD/Stoch RSI.
🔴 Bearish Scenario:
Break of support at 15.97 and the trend line → possible decline to 14.83 or lower (13.30).
MACD may continue to decline if a strong rebound is not achieved.
🧠 Summary
Trend: Bullish
Price is currently testing resistance at 18.27.
Key support levels to watch: 15.97 and 14.83.
Indicators are providing potential buy signals, but confirmation will be needed on higher time frames or on stronger volume.
