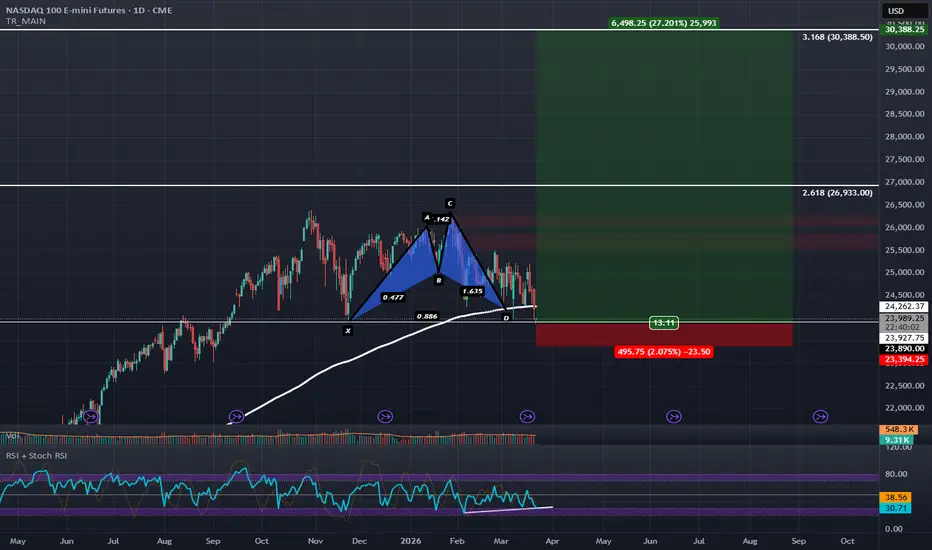
Nasdaq Futures is Holding Support for the Third TimeNasdaq Futures has been trading around the 200-day EMA and .886 PCZ of a Bullish Shark for awhile now kind of in line with what the S&P-500 Futures have been doing.
This level aligns with the August 2025 High and it seems to be diverging bullishly on the RSI here. Things should get more confident if we can trade back above the 200- day EMA just above the current price as we gap-down into support for the third time.
I think equities are likely to rally as Crude Oil futures come down signific
200dayema
Kaspa (KAS) Long-Term Spot Trade SetupMarket Correction Impact:
Kaspa has retraced 40% following the market correction this weekend, breaking back into its range.
Historical Significance:
Historically, such retracements with KAS have marked local bottoms on the chart.
Price Action to Watch:
If the price pulls back this week to fill 50% of the wick left behind on yesterday's daily candle and retests the mid-range support area along with the 200-day EMA, this will offer a great zone to DCA (Dollar Cost Average) into a long-term tra
FINEOTAX CHEMICALS is in great UPTREND hey guys ,
FINEOTAX CHEMICAL stock is in great uptrend
this stock has recently crossed it's ALL TIME HIGH
and given a great green candle .
Also the VOLUME is also very high .
The 20 day ema is above the 50 day ema ,
and this stock is very away from 200 day ema
in a UPWARD direction.
i have marked the RR RATIO for you
try to trade according to that.
FINEOTAX CHEMICALS 😀😀
Market Finally Making a Potential BottomThanks to FED & Jerome Powell for shaking market by its Roots and causing HAVOC in the market recently.
IF Stock Market doesn't stop here then we can well be in a RECESSION Territory after Breaking this Lower Low :-
Tightening Monetary Policy, Increasing Interest Rates, & Cutting off Asset purchases and clearing their sheet by selling Assets they are holding to increase their cash on hand.
They are pulling cash out of the system. All of this is WAY TOO AGRESSIVE approach, that market did
GBPNZD Possible short opportunity on GBPNZD.
We have seen rejection at resistance for the 4th time and so we can expect some bearish momentum.
A break of the 200 day EMA and the trend line at the 1.8975 level would call for a short opportunity where we could see price return to support at the 1.8610 level.
Confirmation of breakout:
- Closed bearish 4Hcandles
- Price breaks below 200 day EMA
- Break in the trendline
- Signals from MACD andRVI
I find GBP pairs to be rather volatile so I would advis
EURCAD - ShortPossible short opportunity on EURCAD.
There has been rejection at resistance (previously was support) and momentum may be turning bullish.
If price moves below the 200 day EMA this gives an indication of bearish momentum and so we could see price break the trend line at 1.5490 and head to the 1.5340 level or the 1.52000 level. At these levels, we have seen bullish momentum and so these areas could take profit targets.
USDCHFPrice has been ranging between support and resistance levels since the end of July.
Recently, price broke through resistance on the 22nd of September. As price has now reverted back down to a level of previous resistance, we could see price reject at this level and at the 200 day EMA to create bullish momentum and move upwards. If there is confirmation of bullish rejection at this level (closed 4H bullish candle), I will take a long position.
However, before price entered this consolidation z
Another Bearish Bitcoin Indicator: 200 EMA & MA BearcrossA quick look at the projected 200 EMA & MA bear-cross on the Daily chart. From the March 16th 2018 bearcross at $8,273, the bullcross didn't occur until over a year later on April 4th 2019 at $4,911 after a 40% correction. The current gain in price since this 2019 bullcross has been 60%. Unless the price moves above $8500 within the coming days, the EMA & MA bear-cross is due to occur by the end of the week.
Many traders complain that due to Bitcoin's volatility the MA bull & bear crosses on lo
BTCUSD: Stuck In A Symmetrical Triangle Ready To Break On 1 HrFor over a day and a half Bitcoin has formed a symmetrical triangle against the dollar, while being stuck between the 200 Day MA and the 200 Day EMA . The symmetrical triangle is 52 bars (2d4h) long with 75% completion working out as 39 bars (1d15h) - the current hourly candle. Notably the 200 Day MA is no longer in the triangle, so a retest would therefore breach the triangle pattern. I'm therefore now looking for a small move 6%+ in either direction, likely retesting the breakout levels (or t
BTCUSD: Price stuck Between 200 Day MA & EMABTCUSD price is stuck between the 200 Day MA at $8,311 and the 200 Day EMA: $8,768. Waiting for a close above 200 Day EMA ($8.8K) or below 200 Day MA ($8.2K) to open a long/short position. Daily RSI oversold, CMF has turned bearish, MACD looks tragic. Waiting for the next breakout or fakeout, likely downwards.