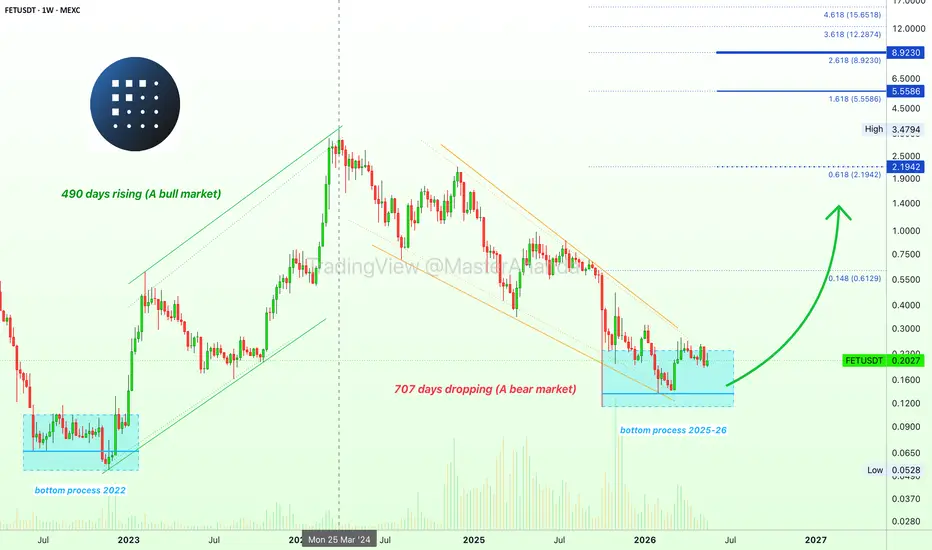
FetchAI, the downtrend ends (3,778% profits potential)The same bottom range from October 2025 is still active today. The same bottom range on FETUSDT has been active for more than 11 months. Almost an entire year trading at bottom prices.
A bear-market can lasts an entire year. A bull-market can last one year but also two, three, four years or more. A bottom process tends to last 3-6 months, not more.
When a bottom process becomes extended as the one seen here, on FETUSDT weekly, this can be interpreted as good news. Obviously, there is no downtr
Artificialsuperintelligencealliance
The AI Infrastructure Trade — A Probability Read on Where We AreThe AI Infrastructure Trade — A Probability Read on Where We Are
If you're holding from the broader AI infrastructure basket — NVDA, AVGO, AMD, ARM, MU, MRVL, TSM, LRCX, AMAT, KLAC, ASML, ANET, SMCI, DELL, HPE, VRT, ETN, PWR, HUBB, JCI, TT, GEV, CEG, VST, EQIX, DLR, GOOGL, AMZN, META, MSFT, plus SMH/QQQ/SPY benchmarks — here's what a multi-filter structural read says about the probability distribution of where the basket is likely going over the next 1-12 weeks. Not a recommendation, not a predi
Fetch.Ai (FET): Long-Term Growth, Proud & HappyWe are again focusing on the long-term and this is really the key. It is like I had an epiphany, a very strong realization. A realization about something that I've been writing about for months, the new market cycle. And I hope the content is to your liking and that it can entertain you if only for a few minutes, because these articles tend to be very short.
If I repeat some things often, just know that not everybody reads everything every single day. People come and go, some themes need to be
FET · The Start of a New Bullish Cycle, Nature & The MarketI always ask myself this question—I see the market as a unit rather than considering each project and chart in isolation—can FETUSDT grow, massively, while Bitcoin crashes? Can hundreds of altcoins produce sustained growth, several months in succession, while Bitcoin is undergoing a major bear market?
FETUSDT (Artificial Superintelligence Alliance—a mouthful) went through a full complete cycle with perfect chart proportions. A bullish period followed by a bearish period. The bearish period ends
Fetch-AI · The bull market starts now, early 2026Let's consider the huge difference between the linear and logarithmic charts.
This is FETUSDT weekly linear:
Notice how easy it is to see growth potential and bottom prices. We can see FET trading really low with plenty of room available for growth.
Now, look at FETUSDT weekly log:
Can be confusing. I use the logarithmic to be able to see the highs and the lows, the full candles. When it comes to the long-term picture and how the market is doing, it is good to consider the linear chart bec
FetchAI—two steps sequence & long-term bull market ($5.6 - $9.1)The same sequence is repeated over and over. It is a two steps sequence. 1) Very low prices after a major bull market precedes a new bull market. 2) The catalyst comes as the highest volume ever.
This two steps sequence, a bottom accumulation range followed by the highest volume ever has been repeated twice; in 2020 before the 2021 bull market and also in late 2022 before the 2023-24 bull market.
The same sequence has been activated once more, we are only missing the bull market. In 2026, FETU
FETUSD Will it continue on its historic bullish pattern?Artificial Superintelligence Alliance (FETUSD) has been trading within a 6.5-year Channel Up ever since its first trading day. The pattern's Bullish and Bearish Legs are very distinct and since its March 25 2024 All Time High (ATH), the market has been on the latest Bearish Leg (red Channel).
The 1W RSI just touched its 30.00 oversold barrier and last time it did so on a Bearish Leg (June 13 2022), the bottoming process (Higher Low) started towards the 0.236 Fibonacci level of the multi-year Ch
FetchAI · $3.33 · Elliott & Market WavesFetchAI is in a standard situation. Notice how small is the first bullish move. This is always wave 1. Between 7-April and 23-May.
Wave 2 would be the consolidation pattern and here is why I continue to say that the next high will not be the end of the bull market.
Wave 3 is the next advance, the one that will develop after FETUSDT breaks out of the consolidation pattern. The peak can be $3.33 or can be higher.
After this peak, we have wave 4 which is another correction similar to wave 2. The
Artificial Superintelligence Alliance (FET) Enters Bullish PhaseThere is always really high volume on this chart. FETUSDT trading is very active and this is always a good signal regardless of the overall picture. It means there is interest in this trading pair. Some pairs you can see have absolutely no volume and you know only bots are trading it. When volume is high, you know there are some people buying and selling behind the scenes and when the market goes on a trend, it tends to produce wild moves. So high volume is always good.
The trend is the uptrend
FETUSD is an excellent buy, targeting at least $3.75Artificial Superintelligence Alliance (FETUSD) or otherwise known as FETCH.AI has been trading within a multi-year Channel Up and right now is on its latest Bullish Leg and quite possibly the last for this Cycle.
Given that all similar Bullish Legs that started with 1W MACD Bullish Crosses that low, grew by at least +1012%, we expect a minimum Target for this Cycle at $3.75. If it follows the more aggressive +2041% rise of 2023/ 2024, we can even see $7.00 but that is the more optimistic scenar
FET Correction Bottom Confirmed —Buy OpportunityThe next All-Time High for FETUSDT in late 2025 or early 2026 can reach between $5.42 or $8.56, giving us more than 1,600% profits potential from the current price. This is taking $8.56 as the next All-Time High. Let's get that part out of the way because I want to show you the end of the current correction. I am using the linear scale so it won't let me show you higher targets on the chart.
There was a resistance level in April 2022 as the bear market developed. This resistance was confirmed a
The key is whether it can find support near 0.846 and rise
Hello, traders.
If you "Follow", you can always get new information quickly.
Have a nice day today.
-------------------------------------
(FETUSDT 1D chart)
The M-Signal indicator on the 1M chart is abnormal, so the key is whether it can hold the price.
If the price is maintained above the M-Signal indicator on the 1M chart, it is highly likely that the upward trend will continue in the medium to long term.
Accordingly, we should check whether it can be supported and rise around 0.846.
I
#FETUSDT #4h (Bitget Futures) Falling wedge breakout and retestFetch just regained 100EMA support and looks good for bullish continuation from here.
⚡️⚡️ #FET/USDT ⚡️⚡️
Exchanges: Bitget Futures
Signal Type: Regular (Long)
Leverage: Isolated (4.0X)
Amount: 5.0%
Current Price:
0.7863
Entry Zone:
0.7806 - 0.7504
Take-Profit Targets:
1) 0.8561
1) 0.9244
1) 0.9926
Stop Targets:
1) 0.6897
Published By: @Zblaba
NYSE:FET BITGET:FETUSDT.P #4h #Fetch #AI fetch.ai
Risk/Reward= 1:1.2 | 1:2.1 | 1:3.0
Expected Profit= +47.3% | +83.0% | +118.7%
Possible Loss=
FET Imminent Rise, Easy 333% To 666% Profits PotentialThis is a time sensitive publication. I will explain my thinking and support my conclusions based on TA.
How are you doing in this wonderful day?
Bitcoin is looking good and the Altcoins are looking better by the day. The Cryptocurrency market is heating up and set to grow long-term.
» Imminent, FETUSDT is preparing for a strong rise next.
Here is the thing, the downtrend has been broken. This of itself reveals and confirms a bullish bias.
Next, the 3-Feb. low resistance has been conquered a
Freshly goldencrossed Fetch heading towards inverse h&s targetGoldencross just occurred and so far fetch is responding with a green candle. It has been slowly climbing up its inverse head and shoulder measured move line but we could see it do something similar here to how Render reacted recently. I expect price to hit both of these targets in the near future *Not financial advice*
FETUSD Buy it while it is still cheap.Artificial Superintelligence Alliance (FETUSD), commonly known as Fetch.ai, has been trading within a 4.5-year Channel Up since the March 2020 market bottom and following the 2022 Inflation Crisis that bottomed on the week of November 21 2022, it has entered a new Channel Up.
That is technically the new Bullish Leg of the 4.5 year Channel Up, which is the new Bull Cycle. Naturally, it shares many common characteristics with the previous Bullish Leg/ Cycle. The symmetry between its Legs (blue Ar
FETUSD on the Channel Up bottom. Buy opportunity.The Artificial Superintelligence Alliance (FETUSD) has been trading within a Channel Up since the August 05 bottom. The price is currently at the bottom of the Channel Up and around the 1D MA50 (blue trend-line), where the last Higher Low was priced (September 06).
The proper Support is offered by the 1D MA100 (green trend-line), marginally below. This price action appears to be an attempt to form the new bottom, but since the previous two Bullish Legs were confirmed upon a 1D MACD Bullish Cros