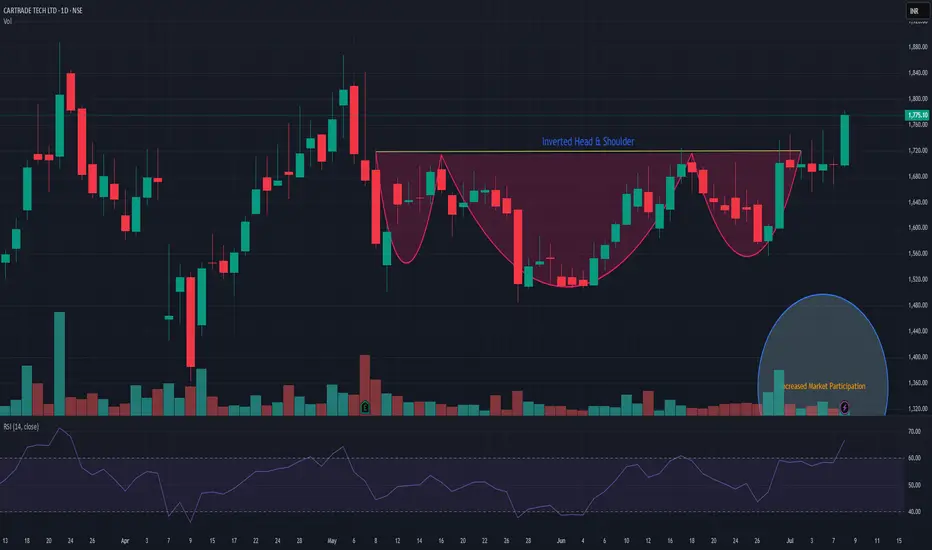
Continuation Pattern in Auto Stock!GAL Analysis
Closed at 637.74 (25-08-2026)
ABCD pattern target achieved around 630 - 650
Now sustaining this range may trigger ascending triangle
pattern targeting around 800+
The last hope in the current case should be 540. Multiple
closings below 540 may bring more selling pressure.
Autosector
Tata Motors: Is the ₹300 Floor About to Give Way?! Can it trade back under ₹100?
The chart for Tata Motors Passenger Vehicles (#TMPV) is indeed signaling a high-stress environment.
The stock recently plunged to a fresh 52-week low of ₹308.65, marking a sharp 10.38% decline in just one week.
This isn't just a standard dip; it is a convergence of severe technical, financial, and geopolitical headwinds.
Why Tata is Facing a "Perfect Storm"
Deteriorating Financials: TMPV has reported negative results for three consecutive quarters, with a half
Maruti Suzuki India Ltd. – Corrective Upside Within DowntrendMaruti Suzuki has completed a five-wave impulsive decline, with the final leg forming an ending diagonal pattern, typically indicative of exhaustion near the end of a downtrend phase. This raises the probability of a near-term pullback or relief rally.
From a structural standpoint, the stock now appears positioned for an upside retracement toward key Fibonacci resistance levels. However, it is important to emphasize that this move is expected to be corrective in nature rather than a reversal of
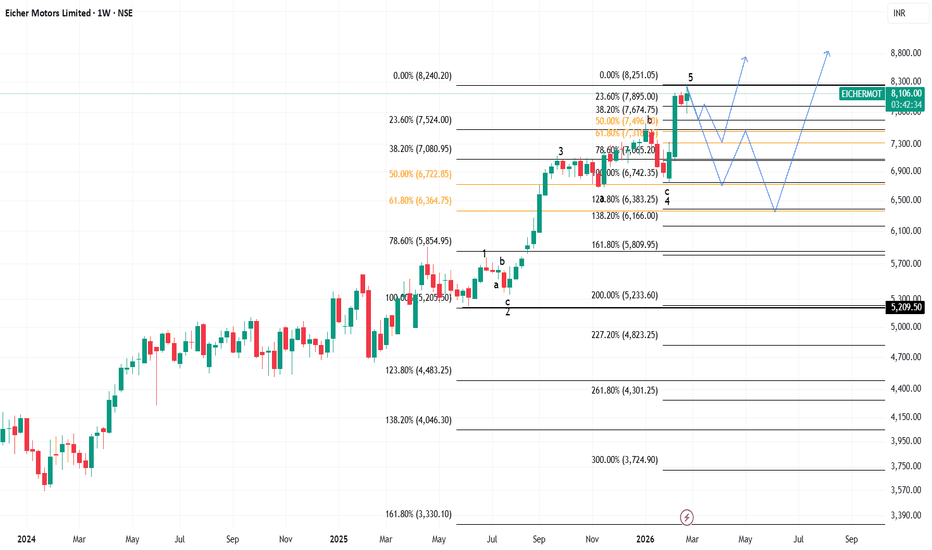
Eicher Motors Ltd.– Anticipating Corrective Phase Within UptrendEicher Motors continues to trade within a broader bullish structure. However, price action suggests that the recent advance has likely completed a five-wave impulsive sequence, increasing the probability of a forthcoming corrective phase.
Following a completed impulse, the subsequent move typically unfolds as an ABC retracement or a more complex corrective structure before the larger trend resumes.
At present, two primary scenarios emerge:
Scenario 1 – Super Bullish Case:
In a shallow retrace
Stellantis | STLA | Long at $9.59Stellantis NYSE:STLA is the maker of the auto brands Fiat, Peugeot, Jeep, Citroën, Opel/Vauxhall, Ram Trucks, Dodge, Chrysler, Alfa Romeo, Maserati, DS Automobiles, Lancia, Abarth, and Vauxhall. The stock has fallen sharply due to a 70% profit drop in 2024, weak U.S. sales, high inventory, and tariff uncertainties. The turnaround for NYSE:STLA beyond 2025 hinges on new CEO Antonio Filosa’s focus on U.S. market recovery, new product launches (e.g., Ram 1500 Ramcharger, Jeep hybrids), pricing
Hero Motocorp: Major Weekly Breakout | Auto Sector Leader
STRONG BUY Setup 🏍️
Entry: ₹5,798-5,820 (Current Level)
Target 1: ₹5,899-5,920
Target 2: ₹6,033-6,060
Target 3: ₹6,251-6,280
Target 4: ₹6,400-6,500+ (Extended Breakout Target)
Stop Loss: ₹5,588
Technical Rationale:
BREAKING OUT from year-long rectangle consolidation (5,588-5,899 range - blue shaded area)
Powerful +4.69% weekly surge showing strong bullish momentum
Testing upper boundary of rectangle at 5,899 (marked "3d 21h" - breakout imminent)
Weekly chart showing major pattern completion
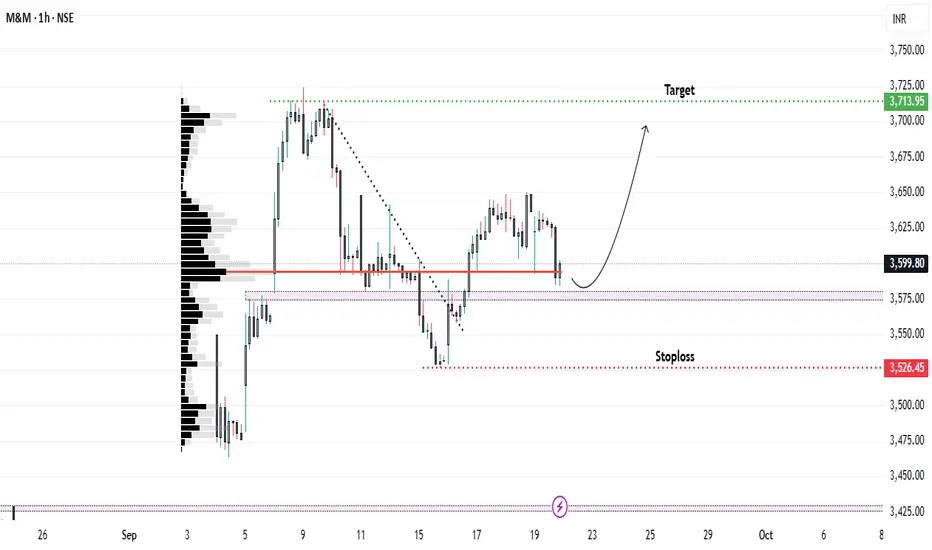
Momentum Rebuilds: Can M&M Hit Recent Highs...?On 8th September, M&M broke the previous day’s high and rallied nearly 4%. However, it soon entered a gradual downtrend on the hourly timeframe, holding the ₹3575 level (the high of 5th September, now acting as support).
After a day of consolidation, the stock broke below ₹3575 and closed beneath it. In the following session, it faced resistance at the same level but later broke above it again, suggesting a false breakout.
Currently, the stock is retesting this zone. The Volume Profile indicat
Equity Research Report – TVS Motor Company Ltd.📌 Timeframes Analyzed: 15-Minute and 1-Hour
📅 Date: May 5, 2025
📍 CMP: ₹2,774.40
📈 Setup: Bullish breakout from falling channel with EMA crossover
🔹 Technical Highlights
Pattern: Descending channel breakout (1H)
Moving Averages: Price is trading above the 20-EMA and 50-EMA with bullish crossover
Volume: Breakout confirmed by increasing volume
RSI (Momentum): RSI is trending up above 50 with positive divergence
🟢 Trade Plan – Intraday to Short-Term Swing
✅ Buy Levels (Confirmation Entry)
Buy
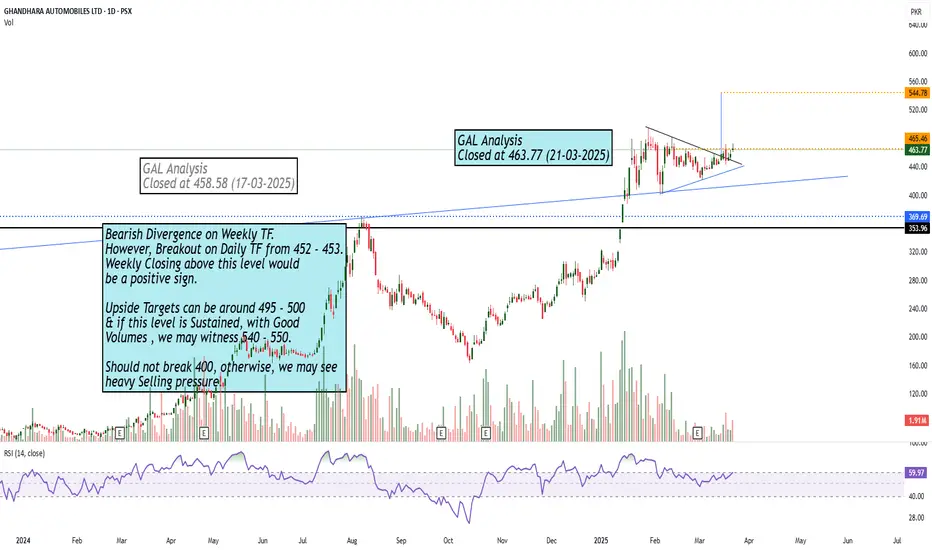
Bearish Divergence on Weekly TF but..Bearish Divergence on Weekly TF.
However, Breakout on Daily TF from 452 - 453.
Weekly Closing above this level would
be a positive sign.
Upside Targets can be around 495 - 500
& if this level is Sustained, with Good
Volumes , we may witness 540 - 550.
Should not break 400, otherwise, we may see
heavy Selling pressure.
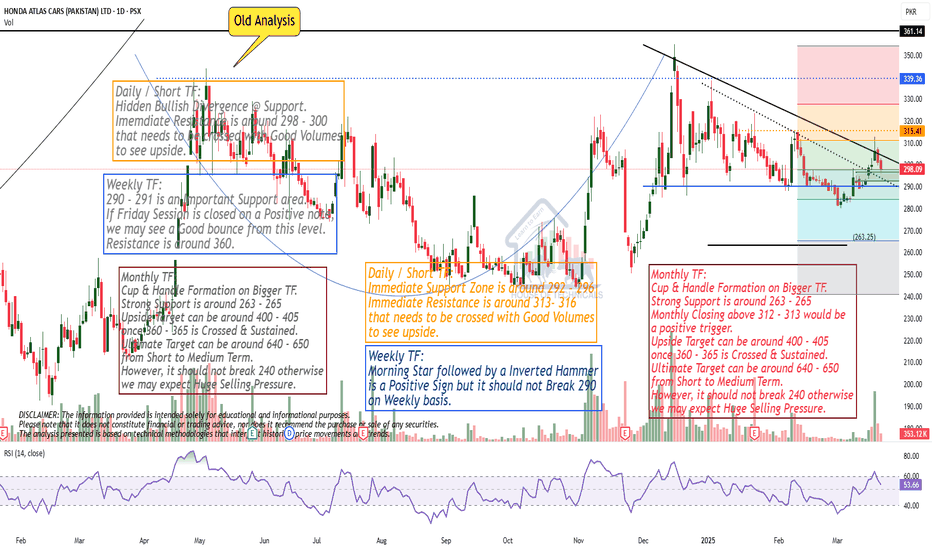
Monthly TF:
Cup & Handle Formation on Bigger TF.
Strong Support is around 263 - 265
Monthly Closing above 312 - 313 would be
a positive trigger.
Upside Target can be around 400 - 405
once 360 - 365 is Crossed & Sustained.
Ultimate Target can be around 640 - 650
from Short to Medium Term.
However, it should not break 240 otherwise
we may expect Huge Selling Pressure.
Case Study based on Elliott Waves on exampled chart Tata MotorsHello Friends,
Today we are plotting Elliott wave counts on Case study chart of "Tata Motors Ltd".
In this study we used Elliott Wave Theory & Structures, it involves multiple possibilities, and the analysis presented focuses on one potential scenario. The provided information is for educational purposes only, not trading advice. There's a risk of being completely wrong, and users are warned not to trade or invest solely based on this study. The content is not an advisory and does not guarantee
MULTIBAGGER Series - Stock 1Hello guys!
I am starting a new series this Diwali, where I will post stocks which may achieve multibagger growth. Investing in such companies bring a high risk factor so please do your own analysis before investing.
The first stock is SHREE OSFM E-Mobility Ltd.
SOEML offers employee transportation services to large multinational corporations (MNCs) in India, serving sectors such as IT/ITES, aviation, and more. The company operates with a primarily asset-light model, where services are typically
RECESSION ALERT | Total Vehicle Sales Data Print DelayedWith last months revision of 818,000 jobs, it is probably safe to conclude that other data points have also been incorrectly reported (manipulated for political purposes).
Total Vehicle Sales for the month of August 2024 were supposed to be published today. As of 8:45 PM EST, the data STILL has not been released.. HUH??
Total vehicle sales are a leading economic indicator. I’m guessing the numbers are bad.. really bad.
In Germany, the economic powerhouse of Europe, vehicle sales collapsed in
FORD - ICE predominates EV falters LONGFord has scaled back its EV ambitions in consideration of the marketplace while TSLA drops
its price in the Eurozone and falls into less than first place in the China EV market. Ford's
F-150 truck continues to dominate GM and the others in North America.
On the 4H chart, first a price uptrend and then retrace to the 0.5 Fib level and a reverse into
a new trend up. A pair of EMAs shows an impending golden cross also suggested by
the zero lag MACD. The two RSI lines ( 60 minutes and 480 mi
#HEROMOTOCO... good in coming session#HEROMOTOCO...
Intraday as well as swing trade
All levels given in charts ...
IF good potential seen then we work in options also
if activate then possible a good movement Keep eye on this ...
We take trade only when it activates...
Possible to give good target
TRADING FACTS
HEROMOTOCORP- Daily/Hourly Timeframe-Tringle PatternNSE:HEROMOTOCO
Entire auto sector has outperformed in past few weeks, However HEROMOTOCO is looking a bit weak as per as per the daily chart, it has broke its previous daily swing low.
Stock is consolidating in tringle in hourly chart. In hourly chart buyers are trying to push price higher (Higher lows) however sellers are defending level 2840-2855.
If it breaks either side we may see a momentum, keep eye.
This idea is only for educational purpose, please manage your risk accordingly.
MAZDA BUY PRICE AT CMP 647 Mazda Limited is an engineering company,engaged in the manufacture of Engineering Goods and the manufacturing of food products, such as food color, and various fruit jams and fruit mix powders
THIS IS BUY PRICE AT CMP 647 WILL GET IN DISCOUNT TOMORROW BECAUSE SAES NO.. SOME WEAK
TAKE LONG TARGET 777 AFTER QUARTER RESULT
WSUP ME FOR MORE ANALYSIS 84 59 22 0202