BANANA Analysis (4H)Given the liquidity pools forming above the pivots and the price reaching our sensitive zone
within the optimized area, we are looking for sell/short setups.
The targets have been marked on the chart.
A 4-hour candle closing above the invalidation level will invalidate this analysis
Do not enter the position without capital management and stop setting
Comment if you have any questions
thank you
Banana

BANANA - UPDATE: #banana - price analysis:
Technically; neutral on the daily basis: 13.50 - 11.70$
Bearish on the weekly basis, but prices seems to be moving between the 15.00 - 11.50$ levels (3 week RANGE High + Low).
My bias:
Bearish HTF, and 10.00$ demand zone could be visit again,
At the opposite, bottom could be in if price keep consolidating inside the blue box, but Bulls must flip & confirmp breakout above 15.00$ & daily downtrend to regain momentum.
Very tricky short term PA, big move is probably cooking 💣

BANANAUSDT UPDATE#BANANA
UPDATE
BANANA Technical Setup
Pattern: Bullish falling wedge breakout
Current Price: $0.8730
Target Price: $1.4020
Target % Gain: 60.62%
$BANANA is breaking out of a falling wedge pattern on the 1D timeframe. The breakout suggests bullish momentum with a potential move toward $1.40, offering over 60% upside. Structure supports continuation if buyers sustain control. Always use proper risk management.

BANANAUSDT Forming Falling WedgeBANANAUSDT is currently trading within a falling wedge pattern, a bullish formation that often signals the end of a downtrend and the beginning of a strong reversal. This setup shows price consolidating in a narrowing range, while selling pressure weakens and buying interest steadily builds. With good volume backing up this move, the conditions are aligning for a significant breakout.
The falling wedge breakout projection points to potential gains of 90% to 100%+, making this pair an attractive setup for traders looking for strong upward momentum. The volume confirmation suggests that accumulation is already happening in the market, which could fuel a sharp rally once resistance is broken. This aligns with the broader trend where investors are showing renewed confidence in the project.
With increasing investor attention and strong technical structure, BANANAUSDT looks well-positioned for a bullish move in the coming sessions. If momentum continues to build, the coin could quickly rally toward its upside targets, offering favorable risk-to-reward opportunities for traders who catch the breakout early.
✅ Show your support by hitting the like button and
✅ Leaving a comment below! (What is You opinion about this Coin)
Your feedback and engagement keep me inspired to share more insightful market analysis with you!

BANANA has formed a bullish Double Bottom pattern 📊 BANANA Market Update
BANANA has formed a bullish Double Bottom pattern ✅
It has broken out of the red resistance zone 🔴 and the first target is the blue line level 🎯

$BANANA – Gift Below $30, Trend Reversal Confirmed
BINANCE:BANANAUSDT under $30 feels like a gift.
Starting to build here, and if price dips back into the purple zone, I’ll keep adding.
Monthly trend is active off the lows—this looks like a clear reversal. If it holds, I expect new highs over the next 5 months.
Not sure if $22 gets retested, but if it does, that’ll be a major area of interest.
Strong coin. Strong setup. Time to act.

$banana PARALLEL CHANNEL ON BANANA GUN$banana parallel channel on banana gun.
Have we bottomed?
Do we now go to the top of the parallel channel?
I think we go there in june.
Q3 aka july, aug, sep going to be consolidation
Q4 we begin the bull run.

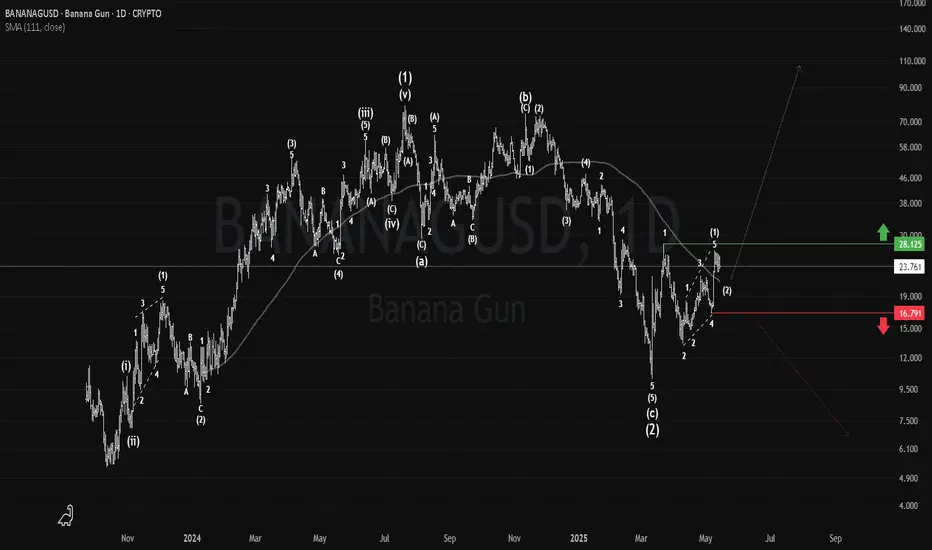
BANANA: The Leader of the Telegram Bots#BANANA led the Telegram bots hype with a 10x rally to $79. Since then, it’s been in a downtrend, but the current range could mark a major reversal zone.
Breaking $16.79 invalidates the idea, while passing $28.13 could trigger a run toward new all-time highs.
#BananaGun
BANANAUSDT Analysis D1BANANAUSDT Descending Trendline Has Already Got Cleared, Banana Can Give Solid Bullish Rally In Coming Days .

BANANA/USDT with a 61.77% potential
BANANA/USDT (6H timeframe)
Current Price: 24.82 USDT
Recent High: 28.19 USDT
Resistance Level Highlighted: 34.28 USDT
Projected Target: Around 34.28 USDT (with a 61.77% potential increase of 13.08 points from current price)
+FVG (Fair Value Gaps):
Two bullish FVG zones are marked, indicating potential areas of interest where price may return for liquidity or support.
Expected Price Movement (Blue Line Path):
A slight retracement is anticipated toward the lower FVG zone (around 20–22 USDT).
After that, a bounce is expected, targeting the major resistance zone around 34.28 USDT.
A heart symbol marks this target area, possibly indicating strong bullish sentiment or a key zone to take profit.
Visual Markers:
Orange box at 34.28: Price target zone.
Vertical purple line: Measures the potential gain (13.08 points or 61.77% rise).

BANANAUSDT – 344% Volume Surge at Key Resistance! “Big volume, big levels—but we don’t FOMO, we wait for confirmation!”
🔥 Key Insights:
✅ 344% Volume Spike – Something is brewing, but is it real?
✅ Major Resistance Zone – This level decides the next big move.
✅ Confirmation is Everything – No breakout? No trade.
💡 The Smart Plan:
Wait for a Clean Break & Retest – No confirmation, no entry.
Watch CDV & Volume Profile – If buyers are serious, we see it here.
LTF Breakout = Green Light – Structure > Hype, always.
“Volume is explosive, but resistance is strong. We wait, confirm, and strike smart!” 🔥
A tiny part of my runners;
🌊 WAVESUSDT.P: Demand Zone Potential
🟣 UNIUSDT.P: Long-Term Trade
🔵 XRPUSDT.P: Entry Zones
🔗 LINKUSDT.P: Follow The River
📈 BTCUSDT.P: Two Key Demand Zones

$BANANA @BananaGunBot ─ Possibly beginning of Accumulation Range🍌 $BANANA @BananaGunBot 🍌
Could this possibly be the beginning of an Accumulation Range?
As usual, my base case is Wyckoff Accumulation Schematic #1.
Time and more data will tell—adding $BANANA to the watchlist.
Clues to Support an Idea:
1️⃣ Prolonged downtrend
2️⃣ Preliminary Support (PS) – Surge in selling volume followed by above-average buying volume
3️⃣ Selling Climax (SC) – Huge increase in selling volume
4️⃣ Automatic Rally (AR) – Short-lived spike in buying volume

BANANA short setup (4H)BANANA is positioned between an SW H and an SW L. Based on the bases that have formed, it seems that this symbol intends to move toward the targets.
Break even at TP 1.
The closure of a daily candle above the invalidation level will invalidate this analysis.
Do not enter the position without capital management and stop setting
Comment if you have any questions
thank you

BANANAUSDT(BananaGun) Updated till 11-03-25BANANAUSDT(BananaGun) Daily timeframe range. we can see a retrace here but need more push to actually get over 19.82. getting over 19.82 is more optimal here below that is a trouble zone. PA found a support at 10.82 breaking below is void zone.

$BANANA - Looks zone ready to me BINANCE:BANANAUSDT - Has had substantial pullback over the days and it looks plum now to flash back on top. We should see it going higher from here now. All the best!

Trading opportunity for BANANAUSDTBased on technical factors there is a Buy position in :
📊 BANANAUSDT
🔵 Buy Now
🪫Stop loss 49.40
🔋Target 1 72.00
🔋Target 2 85.00
🔋Target 3 99.00
💸RISK : 1%
We hope it is profitable for you ❤️
Please support our activity with your likes👍 and comments📝

Possible Banana Hunt Trade soonThe Inverse Semiconductor Fund ( AMEX:SOXS ) will meet again with the Banana Line.

BANANA/USDT: READY FOR A 80-90% UPSIDE MOVE!!Hey everyone!
If you're enjoying this analysis, a thumbs up and a follow would be greatly appreciated!
BANANA looks good here. It breaks out from the symmetrical triangle and also did a successful retest. Long some now and add more in the dip.
Entry range:- $42-$46
Targets:- $53/$60/$68/$81
SL:- $39.5
Lev:- 2x-4x
What are your thoughts on BANANA's current price action? Do you see a bullish pattern developing? Share your analysis in the comments below!

BananasBanana will go Banana
buy Bananas for more banana money
Banana will grow following this banana pattern good luck!!

Banana Gun — More Downside Potential?I felt some excitement when Banana's support level at $58 was held twice, and the token bounced nicely. As mentioned in other posts, I've been waiting for a clear break of the next resistance at 65 to elaborate an entry.
Unfortunately, the second bounce from the support level already delivered a lower high. Therefore, the chances of going lower increased.
And that's exactly what happened. At the third test, the support level broke, and Banana dropped to the next support level at $52. However, so far, there have been no clear reversal signs. On the contrary, a drop to lower levels (45) is even more likely.
Regarding a trade setup, I definitely removed the token from the monitoring list. The bears are absolutely in control right now, and I would be surprised if we had already reached the bottom.

Bullish outlook for BANANA/USDT 1-Hour ChartThe red highlighted area around 55.8338 marks a strong support zone where the price has previously found buyers.
This level has been tested multiple times, indicating its importance.
The horizontal red line at 87.2391 indicates a major resistance level.
This level has been identified as a potential target for the upward movement.
There was a significant spike in price, breaking out above the support zone and moving towards higher levels.
The price is currently consolidating after the breakout, indicating a potential continuation of the upward move.
Ensure proper position sizing to avoid overexposure to market volatility.

🔥 Bitcoin VS Bananas 🍌: Bullish Move After Cooling InflationIn today's analysis I want to shed some light on the Bitcoin divided by the 1000kg Bananas 🍌 price (PBANSOPUSDM). In other words, how many thousands kilo's of Banana's 🍌 can we buy with 1 Bitcoin.
As seen on the chart below, Banana's 🍌 have been gaining nearly 50% in value during the high inflationary period between Nov 2021 - Dec 2022. Recently, the price of Banana's 🍌 has been quite stable.
After reaching the 11 - 8.50 support area after the FTX collapse, the chart reached a critical support zone. Traders saw this as an opportunity to transfer their Banana 🍌 wealth into BTC, with great results.
In my view, we're rapidly approaching the Summer 2021 support area of 23 - 26 thousand kg Banana 🍌 per BTC. Experienced Banana 🍌 traders will most definitely sell some of their Bitcoins for Banana's 🍌 around this area, so watch out for a reversal.
Also, note that the gains on Banana's have been huge over the high inflation period. On the BTC/USDT chart we're already trading at the Summer 2021 support area, but on this chart we're still ~35% away from it.
🍌🍌🍌🍌🍌
Check the date
🍌🍌🍌🍌🍌

Bitcoin Banana Wave Analysis Bullish Sentiment, low circulating supply. Selling alts to accumulate more BTC.
