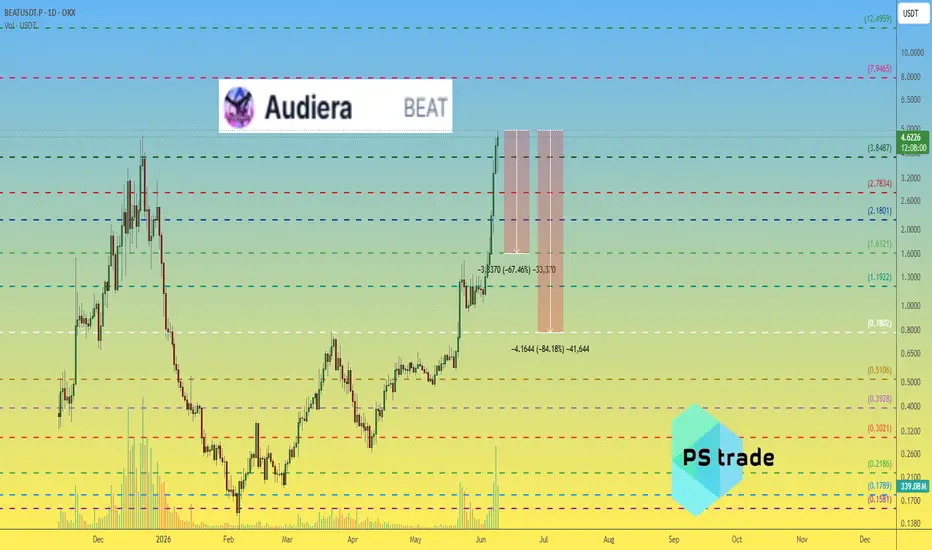
Audiera BEAT price analysisThe market capitalization of the #Audiera project at the time of writing is $1.4 billion.
Whether that’s a lot or a little in the current market is up to you to decide.
7 large green daily candles in a row at OKX:BEATUSDT.P
Peak trading volume was yesterday (though there’s still half a day of trading left today).
All key levels are shown on the chart; use them to your advantage.
As well as the zones where the #BEAT price may correct.
Loyal scenario: up to $1.60; worst-case scenario: down to
BEATUSD
BEAT appears to be gearing up for a bullish move (8H)Before anything else, keep in mind that this is a highly volatile and high-risk asset, so do not forget proper risk management.
The larger structure appears to be an expanding pattern, and we are currently in the middle of Wave D. Wave A of D has already formed, and it now appears that we are in Wave B of D.
As long as the green support zone holds, the expectation is for the price to move toward the highlighted targets and complete Wave B of D.
A daily candle close below the invalidation leve
BEAT Analysis (4H)BEAT has experienced a significant drop, during which it swept a large liquidity pool on the downside. This type of move often indicates a liquidity grab rather than pure bearish continuation. However, the price has not yet shown a strong or convincing recovery, which suggests that the market is still searching for a proper support level.
Based on current price action and structure, we expect the price to move further downward toward the marked zone, where a reaction and potential support forma
Overbought But Still RippingHey guys, BEAT just delivered a monster +47.49% rally in 24 hours and is now trading at $2.68, sitting about 5% below the session high of $2.82. This thing has been absolutely ripping, but now we're at a critical juncture where the technicals are giving us mixed signals and we need to be smart about our next move. Let me break down what's happening and where the opportunities might be.
First off, this is a relatively new asset with limited historical data, so we're focusing purely on recent pri
Bearish Market Structure Forming - Anticipating a Decline TowardThe price has developed a clear bearish market structure within an ascending channel. After completing what appears to be an A–B–C corrective move , the market has reached point C, where upward momentum has begun to weaken. The reaction from the upper boundary of the channel suggests that buyers are losing strength and a reversal is likely forming.
Price also failed to maintain momentum above the mid-channel area, indicating a potential shift from accumulation to distribution. Given the st
BEAT Analysis (1H)The reason for the recent pump in BEAT is the collection of a liquidity pool beneath the chart.
Given the series of lower highs and lower lows, a resistance zone has formed on the chart.
In this zone, we are looking for sell/short positions.
The targets are marked on the chart.
A 4-hour candle closing above the invalidation level will invalidate this analysis.
Do not enter the position without capital management and stop setting
Comment if you have any questions
thank you