High-Impact News: Liquidity Sweep & Turtle Soup SetupThis idea focuses on price delivery around high-impact news and how liquidity can be targeted before a major expansion.
The H4 chart provides the higher-timeframe market structure, range and major liquidity areas. The main focus is the external range liquidity and the overall direction of price.
The H1 chart highlights the Fair Value Gap and the Range Low. This area can act as an important reaction zone if price moves lower to collect sell-side liquidity.
The 15-minute chart shows
Bestanalysis
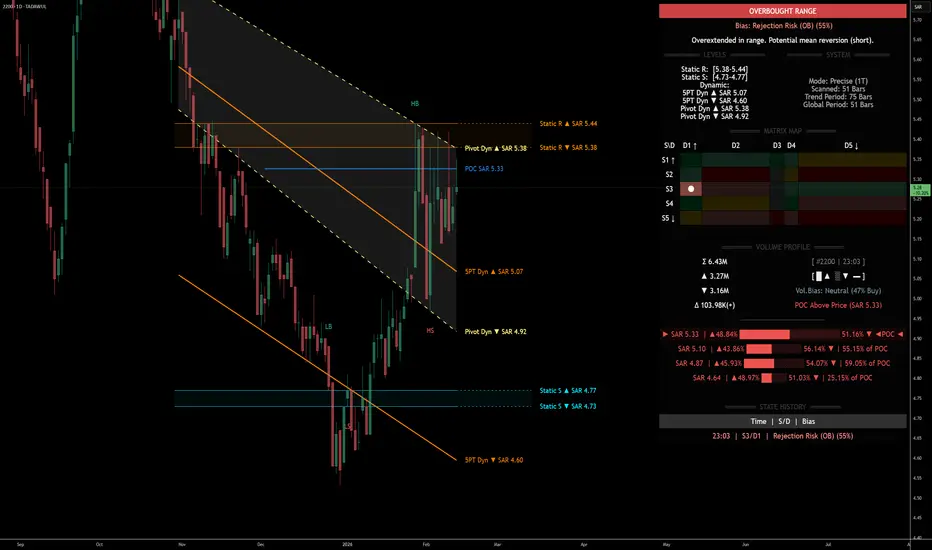
2200 | OVERBOUGHT RANGE — Rejection Risk at Static Resistance TADAWUL:2200 — 1D Chart | DSRTL-ML Algorithmic Reading
Matrix State: S3/D1 | Confidence: 55% | Bias: Rejection Risk (Overbought)
Price at SAR 5.28 sits mid-range between Static Support (SAR 4.73–4.77) and Static Resistance (SAR 5.38–5.44). The Dynamic state reads D1 (Overextended Up), meaning price is stretched above dynamic equilibrium without structural confirmation. This creates a classic overbought-in-range condition with mean reversion pressure.
Key Structural Observations
A resistan
ONE ANALYSIS ON GOLD YOU DON'T WANT TO MISS!!GOLD TRADE ANALYSIS FOR 26/02/2024
2043 AND 20147.98 WILL BECOME IMPORTANT LEVELS FOR GOLD
2043 Will be the target and 2047.98 will be second.
Anything between this levels must be taken with cautions, this is where the price will make decisions to either go down. Or break up to 2062.23
Or it could break down to come for liquidity at exactly from 2030.79
Between 2030.79 and 2043 should be safe range to trade on Monday.
Anything above or below this levels to be confirmed strongly
BestZone 4 Long in XAUUSD(Gold)Ok, today I want to publish an idea that may have many opponents!
As you can see in the picture above, I examined gold in several timeframes at the same time and finally, according to the conditions in the market, I reached the results that I would like to share with you, my dear friends.
In the picture above, everything is clear, the general trend of gold is currently upward, but I expect a correction from it. I have determined two zones for the price return from those. Please place a limitorde
Should You Buy TSLA Stock NOW??!!! Best Prices Hello everyone. I hope you are doing perfectly. So, today I wanted to share my perspective on TSLA stock. In this published idea, you can see three aspects of the analysis: technical, fundamental, and sentimental (all are my humble opinion). Now let's get to the real deal.
Technical Analysis
As you see on the chart, there is a high possibility of pulling back on the trend line since the price is over-saturated, and we can see that the last minor wave has given its 0.618% correction.
With thi
BTCUSD Time serise . daily timeframeIn the daily timeframe after the start of the uptrend in March 2020, the downtrends that formed after the uptrend all corrected about 50% of their previous wave time, so according to the previous cycles, I expect on January 7-8, the bitcoin phase Start your ascent again. You can see in the chart
How to short Bitcoin in a bull market using these indicatorsFirst things first, Happy Easter everyone! Here is my Easter surprise for you all. I was going to make this analysis private but figured given the current climate around the world, some festive spirit was required, so here is an analysis you must follow.
Click the like button and give us a follow if this interests you. Comment below and let me know what your thoughts are.
If I get 500 likes I will unveil my BTC price and date forecast for the ending of this bull run which I privately posted else
How to buy Bitcoin in a bull market using these indicatorsFirst things first, click the like button and give us a follow if this interests you. Comment below and let me know what your thoughts are.
This is similar to my last BTC analysis where I showed how to short or sell BTC at a success rate of 92.98%. This time I am not using the Bollinger Bands as the success rate was under 90% which isn't up to my standards.
As you can see on this 4hour chart of BTC , I use several indicators to show how when these indicators are used together you can buy or lo
Is Bitcoin Bull Run Finished? Has the Bear Market started?So, previous analysis was privately published and indicated the top was near and that April or May we would see BTC drop in price. This all coincides with my big picture of BTC which I outlined over 12 months ago what the path forward until Dec 2022 would look like. So far I have been correct except the last month's drop was more than expected.
This chart is explained in explicit detail here: www.youtube.com along with many other charts and graphs to show the path forward for the next 3 to 6 m
Is Dogecoin about to crash or go to 70 cents? Dogecoin analysisOn the weekly log chart we see here I explain in detail about Dogecoin and all the indicators you need to know when to buy and sell this altcoin.
Will Dogecoin crash to 20cents?
Is Dogecoin one of the most bullish coins in the market for the last 5 years?
This chart is explained in explicit detail here: www.youtube.com along with many other charts and extras to show the path forward for Dogecoin.
Happy trading legends!
HTBB
Take a look at my other charts and analysis below to see my unbeliev
LUNA - good areas to buy on it's way to $26First things first, click the like button and give us a follow if this interests you. Comment below and let me know what your thoughts are.
As you can see on this daily chart LUNA has hit the bottom of a long term trend on the RSI indicated by the light blue up arrow. My buy area is between the yellow and green line on the RSI.
The red horizontal lines on the RSI show the overbought zones.
On the LMACD the orange down arrow shows where LUNA crossed over the light blue horizontal line and has n
Polkadot will introduce new millionaires to the world??????Technically if #polkadot can broken 5$ : we will see 5.56 for the first TP1 and if it breaks this price ' we will see the peak of price again for TP2 and This will not be out of reach. SO the #polkadot family have to push it up and #Gavin_Wood must work harder than ever.
There is a few resistance and support but reactions of polkadot to support and resistance aren't irrational.
what do you think? Share your ideas and don't forget to like and share it with your friends ?
WEB3 changes the world