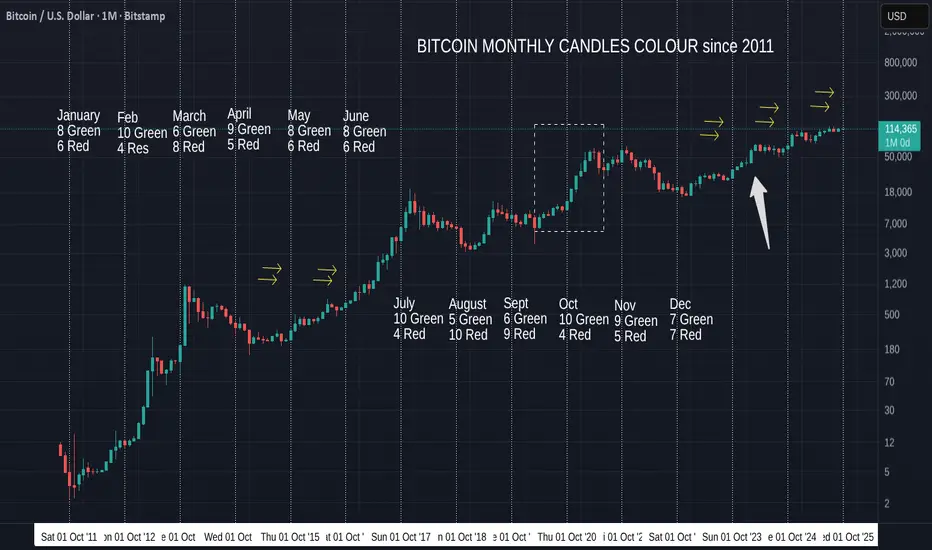
Bitcoin Monthly Candle colour Close since 2011- Looking GOODOCTOBER CLOSED RED
October closed RED for the 5th time in Bitcoin History.
On 3 occasions, it was in a BEAR market, Once was in a Bull Run, in 2012 and the one that just closed Red,
We have to wait and see how things unfold from here.
Is this the End of this Bull run ?
Many will say so and this could be supported by the information above. The Majority of RED Octobers are in Bear markets.
Lets look closer
The left Box shows the only similar monthly Candle sequence, similar to the one we currently have. If you look closely, it is also a very similar "Curve" shape. Descent to low, rise, flatten out.
The Candle Sequence to see is Red, Green. 2 Red. 4 Green, 1 red, 1 Green
That Sequence was followed by a RED Candle, which we have just also done.
The Thin down facing arrow in the left Box, points to the equvilant candle to the one we just had.
The difference being when this happened.it was in Different months. the left box starting in September 2022.
IT WAS THE END OF THE 2022 BEAR market.....
The first Red candle in the current sequence was in December 2024
Some say we have entered a mini Bear a few months ago.......with long term holders selling coins, as is generally accepted as end of cycle action.
But these Coins all got bought right back up....Demand still exists.
The Large Green candle after the Red, Green. 2 Red at the start, in the left box , was January 2023, when we began this current "Cycle". The Bull Run.
Could we be about to see a repeat of this ?
But firstly, If we continur to follow this, we can expect a RED NOVEMBER !
But December will be Green and January would be EPIC, similar to the January 2023 Candle.......MAYBE
But this is all Hyposthosis.
The FACTS are :-
Looking ahead-->
Previous NOVEMBER Candle Closes
9 Green to 5 Red - Nearly twice as many Green as Red.
Only One Green November was in a Bear, November 2014.
The Red November in 2011 was the bottom and was the start of Bitcoins 2 year push to ATH.
The Red one in November 2022 marked the Bottom of the Bear, though December was red but a small candle.
Nearly half of the Red Novembers called the Bottom of a Bear, a turning point in market behaviour.
Some charts point to a RED start to November and the Red close fpr October certainly does not point towards a continued Bullish Sentiment.
I do not often point to TA in these month charts But the MACD will be reaching Neutral on Weekly charts by nid / late December.
To me, this points towards the time when Bitcoin has the ideal moment to push to a real New ATH. This could therefore point towards a Red November and then a Green December.... which follows the Sequence mentioned above.
But this is Bitcoin, it is its own Boss.
We have to wait..time will tell but I reman VERY Bullish
Bitcoinmonthlyclose

One year in BITCOIN- easy graphic may show whats next
Nothing complicated here.
The Box on the left is October Last year
Hardly UpTober was it ? PA dived towards the end of September and it recovered 10% by the end of October.
It also had a Red start as can be seen if you look close
This year, we have gone a little deeper into the Red but we do seem to be climbing back out of it and, so, we may well see a Big Take off in the near future.
However, at time of writing, we are still at -7% off the high at end of September before PA dived.
So we do need to remain CAUTIOUS and the fact that we currently have a DOJI Green candle, just recovered from RED on the monthly chart adds to the need to take Care
Last year, we reached the ATH in December as is the traditional Habit in Bitcoin Cycles.
I see no reason as yet why we cannot try this again.
BEAR signals do exist but they are not as strong as the Bullish ideas
It is the Blue line on the chart below that we need to cross and remain above
Time will tell
Lets see what happens after the FED annoucement tomorrow But, again, remain cautious.
The initial response from markets may be False.

Bitcoin Monthly Candle Close colour & Patterns since 2011Septemer Closes GREEN
Where you see 2 Arrows is where we had a Green September after Red August Closes, as we have just had again.
All had Green Octobers Following.
Note those double arrows on the left are in the 2016 build up to 2017 ATH and the ones on the right are in the Current cycle.
Past October closes are 10 Green to 4 Red, so the Odds are we will see another Green October close, though it may not be a large candle.
InFacr, there are a few charts that point towards a Red start till around Second week, 12th - 15th October.
This of course can change but it maybe worth understanding that we may get a bloody month start.
However, given where we are in this Bitcoin cycle, assuming this one will continue as others have, we do not have a year plue left to reach ATH as the 2016 set of arrows would imply.
So my eye is now drawn to the Dashed box that leads up to the 2021 ATH in March 2021.
To many extents, that PA is very similar to that in 2023 (arrow) and if that is to be repeated, we could see a large recovery this month.
One thing that reslly needs to be mentioned is also how small the candles are now.
The pressure is on Bitcoin right now.
Of the 4 Red Octobers, only 1 was in a Bull run.
This months Candle Close Will certainly let us know where we are in a cycle.
That is IF we are still in a Cycle.
As mentioned in a number of posts now, the idea that Bitcoin will Drop away after the next ATH is possibly flawed.
But we have to wait and see what happens.
We can certainly look forward to a positive number of monthsd ahead for Bitcoin and this should take PA above a Long temm line of resistance that has rejected EVERY ATH since Bitcon started.( please refer to previous posts to learn more )
Happy October everyone and do not Panic if we do Dip further to start with
Bitcoin Monthly Candle Colour closes since 2013 - August Close
August closed RED and so now we have 10 red closes to 5 Green.
This has closed the possibility of continuing the pattern we had been following.
The Dashed line Boxes show us The only 2 occasions where we have had a Green December, Red January, Red February, Green March, Green April.
Then we had a Green May 2012 and a Red May 2020
Then both repeated a Green June, Green July.
They both also had had Green August but we just closed Red.
This breaks this sequence for me but I will keep the boxes in place for now just incase we revert back to Sequence.
The horizontal arrows are pointing to the previous 9 Red August Closes.
Where you see 2 Arrows is where this was followed by a Green September. This happened 4 times.
Note those double arrows on the left are in the 2016 build up to 2017 ATH and the ones on the right are in the Current cycle.
September Candle close count is currently is 5 Green to 9 Red, the same as August was.
Of those 5 Green September closes, 4 were after a Red August.
The other Green September was in the 2020 run up to the March 2021 ATH ( Middle dashed box)
Odds are on for a Red September as we see Bitcoin falling below some serious support levels but we should also note how PA is remaining above the 100k line for now.
August and September are traditionally months of Holidays and so trading slows, hence the majority of Red candles
Q4 is the ones to wait for and as you can see from the colour counts, Q4 is usually Bullish
We wait - we Hold and if PA Drops to the possible 104K line where the 200 day SMA sits, I will Buy More.
Scale in

Bitcoin Monthly Candle Close colour and patterns since 2011
At the beginning of June , I wrote this
""On only 2 occasions have we had a GREEN JAN, RED FEB, RED MARCH, GREEN APRIL
And Both of them were on the way to ATH. (Boxes )
On both those occasions we also had a GREEN MAY, though the gains were minimal and one was followed by a Green June and the other by a Red June."
We just got the GREEN June and so this draws my eye to the sequence on the left, ( arrow )
If we are to follow this, then July should be a larger Green (Arrow) - BULLISH
In-fact, in both the sequences we have been following ( boxes), July was GREEN- BULLISH
And using just the month candle colours, we have a higher chance of another Green candle, with July having had 9 Green to 4 Red previously. - BULLISH
However
Of the previous 8 Green June Closes , only 3 went to a Green July - BEARISH
And I have to say, on NONE of the previous Green Junes were we so close to the current ATH.
July 2021 being the closest with a price at 41K, around 18K below the current ATH at the time.
We are currently only around 200 usd below Current ATH
This adds enormous resistance to the ability to rise
I wanted a RED June because I felt it was more sustainable and would lead to a cycle ATH at the end of the year. As can be seen in the middle Box
If we look back toward the 2012 Box on the left, we may now get a Hot July / August , September and then a Cool off for October, November & December.
But something tells me this will not happen.
The Candles for our current cycle in April, May and June are diminishing in size, the opposite of 2012
But they are similar to the 2020 box, except for the red June close.
This could lead to the desired "Cooling" in August & September and a new lift off in autumn.
And if you look at the chart Candle Colour Count, , August and September are usually RED by some majority
This also gives us the Bigger Green July candle that the "Odds" point towards.
So, as ever, we have to wait and see how this plays out.
Odds in favour of a Green July using previous cycle Data
PA position just below current ATH could lead to a slightly Bearish out look in the short term.
And if you are hoping to see ALTS Rally, PLEASE keep your eye on the BTC.D chart
This also points to wards BTC ATH in Q4 this year
And then, we have the BIG question.......Will we ever see a Classix Bear again ?
With so many Holding Bitcoin LongTerm.....How would a Bear market arrive ?
BUY BITCOIN
HOLD BITCOIN
But, as ever, we just have to wait and see,

BITCOIN Monthly Candle close patterns since 2011 - APRIL CLOSE
Again, we got the expected Monthly Close, This time GREEN
April is traditionally a Strong Green Month, now with 9 Green Closes to 5 RED - Nearly twice as many Green to Red.
MAY is a different story, Nearly 50 / 50 previous closes with GREEN having an advantage of 1.
BUT, With April closing Green after the previous months closes, things do look positive.
On only 2 occasions have we had a GREEN JAN, RED FEB, RED MARCH, GREEN APRIL
And Both of them were on the way to ATH. ( Arrows )
On both those occasions we had a GREEN MAY, though the gains weer minimal and one was followed by a Green June and the other by a Red June.
We have had 4 occasions with a MARCH RED, APRIL GREEN, MAY GREEN
Of the previous 9 GREEN April Closes, 5 were followed by a Green June
And of those 5, 2 were followed by consecutive Green candles closes for the following Months.
Though in 2020 sequence ( 2nd Arrow) after a GREEN May close, you can see the candles were not big and we had Red Green Green Red for 4 months then went Green consecutively.
Of the previous 7 Green MAY candles, 4 were Bigger than the previous month candle.
I am more inclined to look at the 2020 sequence in this for now and yet, at the same time, as posted in another chart, I am also still looking at the lead up to the 2017 ATH and for this to continue, we need a Bigger GREEN MAY close this month.
There is a very strong line of resistance just over head.
Currently, at time of writing, The opening MAY candle is GREEN but only just
This month is CRUCIAL

Bitcoin Monthly Candle close colour patterns since 2011We got the expected RED March close but it was a close thing.
but, this creates better Odds for a continued push to ATH.
We have had only 3 occasions when we had a Green Jan, Red Feb, Red March ( arrows)
2 of those went on to an ATH the following Year !
The other one was entering a Bear Market.
Of the previous 7 RED March Closes, 5 were followed by a Green April
And of those 5, 4 were followed by consecutive Green candles closes for the following Months.
As you can see, April, May and June do have more GREEN closes than Red on average but May and June is near 50/50
It could be said that March Candle close was a "Spinning Top", showing in-balance / indecision in the market. This is possibly driven by Macro events.
We had a similar situation in 2012 and April was Green, as were the following months.
We had 2 other occasions with small Red candle bodies in March, both were Hammer Candles, one inverted, that led to a red April, the other was not and let to a green April.
The March close we just had, had a Long Upper Wick. To me, this shows the BEARS had the upper hand, keeping driving down.
And thats OK, PA needed to reset but we now need a GREEN April
Statistically, April should close Green - We currently have a Score of 8 Green to 5 Red month closes for April.
April seems to have opened GREEN and I hope to see it close that colour though we do need Caution
Because of the Colour sequence over recent months, there are not many comparisons to use.

Bitcoin Monthly & Weekly Bottom 2021
Bitcoin Monthly & Weekly RSI Close for 2021
Buy Low sell High, last chance.
