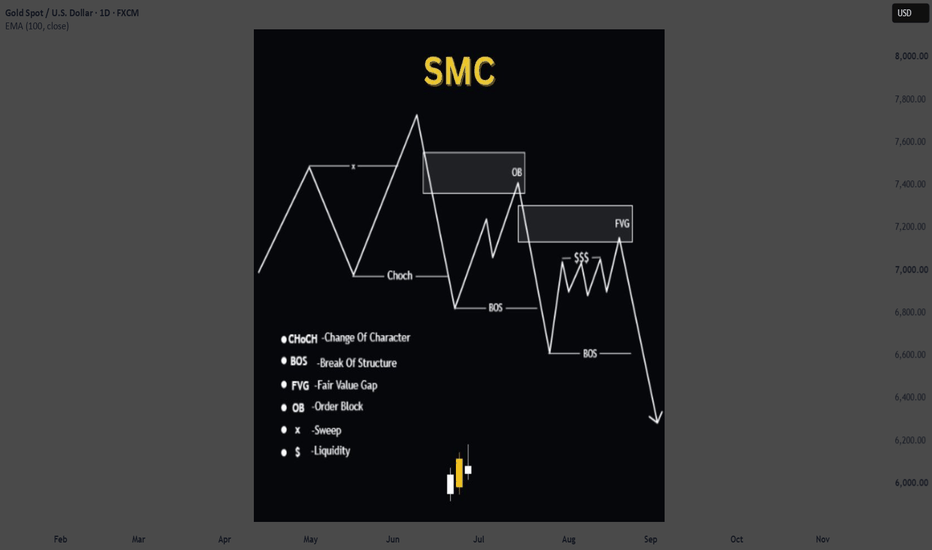
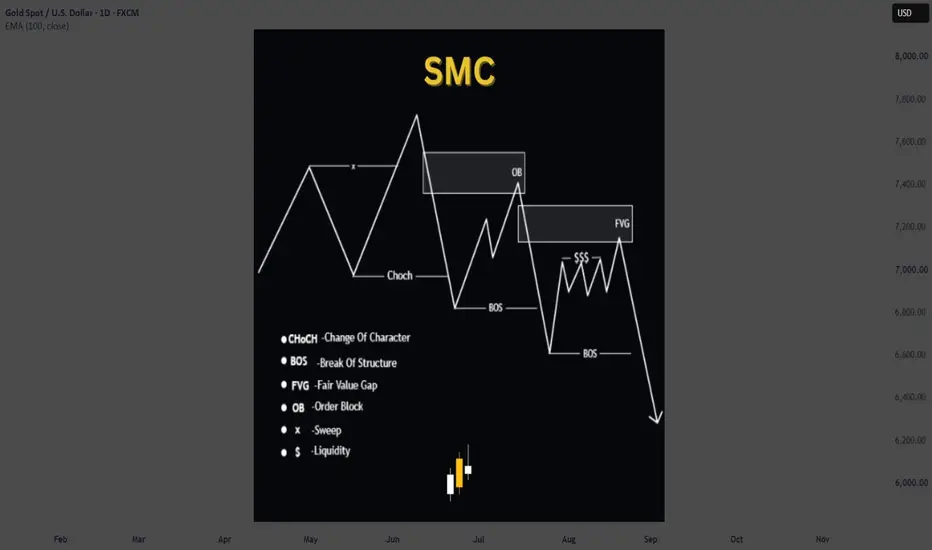
BOS vs CHOCH — Continue or Reverse?BOS and CHOCH both describe a break in market structure, but they do not mean the same thing. One usually confirms that the trend is still alive, while the other warns that control may be shifting.
1. BOS — Break of Structure
A BOS happens when price breaks an important swing point in the direction of the current trend.
In an uptrend, price forms higher highs and higher lows. If price breaks above the previous high, that is a bullish BOS. It tells us buyers are still in control and the tren
Bos-choch
EUR/USD Sell SetupEUR/USD has shown a clear bearish reaction from the 1.1700 resistance zone and has now broken below the key 1.1550 support area. The strong reversal candle suggests that sellers are taking control.
The current setup looks for further downside movement toward the 1.1355 level, which is the next major support area on the chart.
Sell Bias: Bearish 📉
Target: 1.1355
Key Confirmation: Support break + strong reversal candle
Risk Management: Always protect your capital with proper SL.
XAGUSD (Silver) Bearish Structure Shift: FVG Retest and SSL Educational analysis: not financial advice
Silver has spent the past two months moving from a strong bullish phase into what looks like a bearish shift in structure. Here is how the chart reads.
1. The bullish leg
From the July lows, price printed three clear Breaks of Structure (BOS), each one taking out a prior swing high. That is a textbook uptrend, with buyers in control and higher highs forming.
2. The shift in character
Near the 70.00 to 71.00 area, price failed to hold. A sharp, impuls
The current rebound from 4,259 is importantXAUUSD — GOLD MARKET ANALYSIS
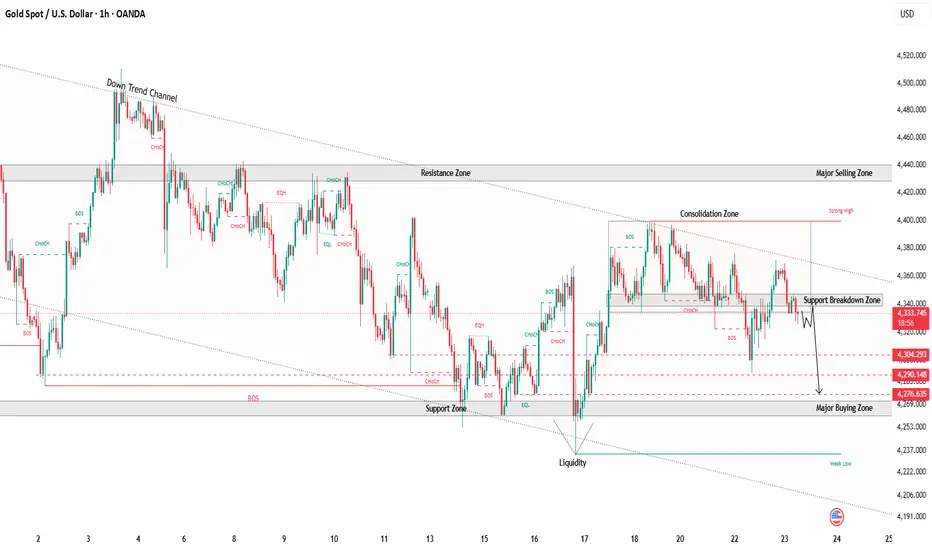
Gold Spot / U.S. Dollar | 1H Timeframe
Gold continues to trade within a descending trend channel, maintaining a bearish market structure. Price previously broke down from the 4,301–4,305 support/breakdown zone, followed by a retracement, and has now reacted strongly from the 4,259 support area.
The current rebound from 4,259 is important. If price moves higher, the 4,301–4,305 region remains a key resistance area where selling pressure could re-enter. A rejection
Structure Shift: From Bearish Reversal to Bullish ContinuationNot every drop is the start of a new downtrend, and not every bounce is the start of a new uptrend. This chart shows how Smart Money order blocks mark the exact moment structure changes — twice.
Reading the shift :
1- Break of Structure (BOS) : an impulsive move down breaks the previous low, confirming bearish control.
2- First retest : price returns to the Bearish Order Block (the last up-move before the drop) and gets rejected — supply still in control.
3- Second retest : price c
MARKET STRUCTURE HH • HL • LH • LL • BOS • CHOCH / MSSMARKET STRUCTURE
HH • HL • LH • LL • BOS • CHOCH / MSS
Understanding Market Structure is one of the most important foundations of technical analysis and price action.
Before searching for an entry, traders should first understand what price is doing, where the important swing points are, and whether the market is continuing its current direction or potentially changing character.
Market structure allows us to organize price movement into a clear sequence of:
🔹 Higher High — HH
🔹 Higher Low
Gold (XAUUSD) is currently showing strong selling pressureXAUUSD — Strong Bearish Breakdown | 1H Market Analysis
Gold (XAUUSD) is currently showing strong selling pressure and a clear bearish structure on the 1-hour timeframe. Price has been moving within a strong downward channel, with sellers maintaining control of the market.
Gold has also delivered a strong breakdown from the recent consolidation zone, followed by a decisive breakdown around the 4339 area. This confirms increased bearish momentum and suggests that sellers are currently dominating
ORDER BLOCKS — UNDERSTANDING INSTITUTIONAL PRICE ZONESOrder Blocks (OBs) are one of the most important concepts within Smart Money Concepts (SMC). They are price areas where significant buying or selling activity is believed to have occurred before a strong market displacement.
Instead of chasing price after a large move, traders can study the origin of that move and identify potential areas where price may react again.
WHAT IS AN ORDER BLOCK?
An Order Block is generally identified as the final opposing candle before a strong impulsive move that
Gold Builds a Base — Long the OB, Then Flip at SupplyXAUUSD · 4,344.66
Last week's FVG idea never delivered the clean push. Instead price capped out around 4,400 on the 18th–19th and rolled back over, leaving a fresh SSL pool just beneath 4,340 — right where we're sitting now.
The map here is two-legged, not one:
Leg 1 — the long. That SSL under 4,340 is the obvious target for a sweep. Below it sits the Bullish OB at 4,305–4,320, the block that launched the entire move off the 17th low. If price raids the lows and reacts from that OB, it's a cl
Gold 4H — Support & Liquidity SetupGold is currently trading near a strong support zone around 4,200–4,250. Price remains below the descending trend line, showing short-term bearish pressure.
A BOS (Break of Structure) has occurred, while liquidity is resting around 4,500. If price holds the support and breaks above the trend line, we could see a move toward the 4,500 liquidity area.
Key levels:
• Support: 4,200–4,250
• Liquidity: ~4,500
• Trend-line breakout = potential bullish move
• Below support = further downside risk
SMC Masterclass Pt 2: Strong vs Weak Swings & The Algorithmic Dr🏛️ INSTITUTIONAL MASTERCLASS • PART 2 OF 15 📌 SMC Masterclass Pt 2: Strong vs Weak Swings & The Algorithmic Draw on Liquidity
Market structure is the single most misunderstood concept in modern technical analysis. Most retail traders mark every single minor zig-zag on their chart as a 'break of structure,' ending up completely disoriented when the market steamrolls their levels.
In institutional Smart Money Concepts, market structure is strictly defined by liquidity purges and candle body a
NASDAQ 100 1H Bullish Setup | FVG Retest + Trendline SupportNASDAQ 100 is currently showing a bullish structure after the recent MSS and BOS. Price is approaching the 1H FVG demand zone, which aligns with the ascending trendline and provides a strong area for a potential reaction.
If the FVG holds and price confirms bullish momentum, the next major target is the 29,745 resistance / previous HH. A clean breakout above this level could open the way for further upside.
Key Levels:
• 1H FVG — potential demand zone
• Trendline — dynamic support
• 29,745 — m
ETHUSD 30M | BULLISH BOS — Buyers Targeting 2510–2540📊 ETHUSD 30M — Market Structure Analysis
Current Price: ~2480.4
Bias: 🟢 Bullish (Short Term)
Structure: Price has recovered strongly from the 2380–2400 demand zone and formed a bullish sequence with CHoCH + BOS. The latest move is again pushing above 2480, showing buyers are attempting continuation.
🔥 Key Levels
🟢 Support: 2450–2460
🟢 Strong Support: 2400–2420
🔵 Demand: 2380–2400
🔴 Resistance: 2510–2540
📈 Bullish Scenario
If price holds 2450–2460 and maintains bullish structure:
2480 → 2510 → 25
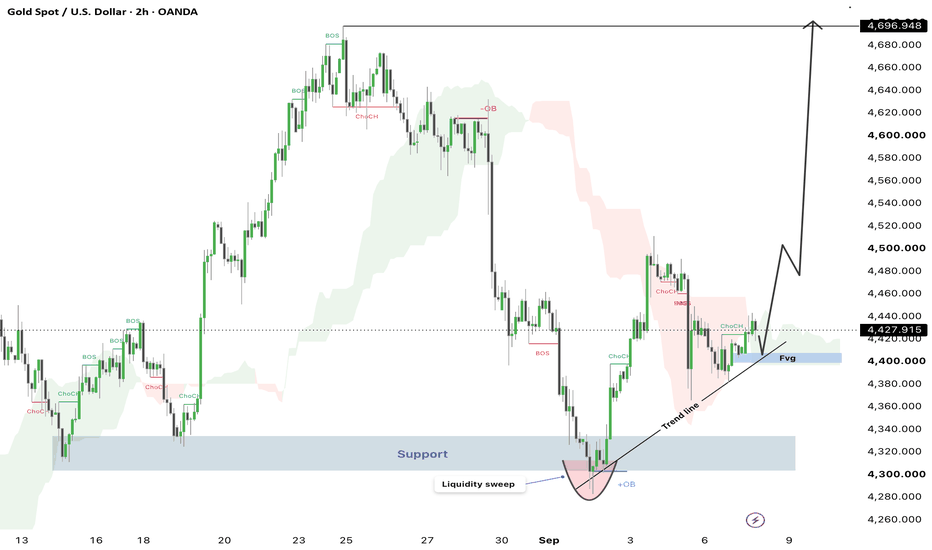
XAU/USD Bullish Continuation SetupGold respected the 4,300–4,325 support zone after taking liquidity below the previous lows. Following the liquidity sweep, price formed a bullish ChoCH and BOS, confirming a potential shift in market structure.
Price is currently holding above the rising trendline and near the marked FVG, which can act as a potential support area for continuation. If bullish momentum remains strong, the next key targets are around 4,650 followed by 4,650-4,700.
Key Level: 4,400 FVG
Major Support: 4,300–4,325
B
Supply & Demand — The Core of Price ActionSupply and Demand helps us understand where sellers and buyers are strongest in the market.
Supply Zone:
A supply zone is an area where selling pressure is strong. When price returns to this zone, sellers may enter again and push price lower. That is why supply often works as a resistance area.
Demand Zone:
A demand zone is an area where buying pressure is strong. When price returns to this zone, buyers may step in and push price higher. That is why demand often works as a support area.
The s
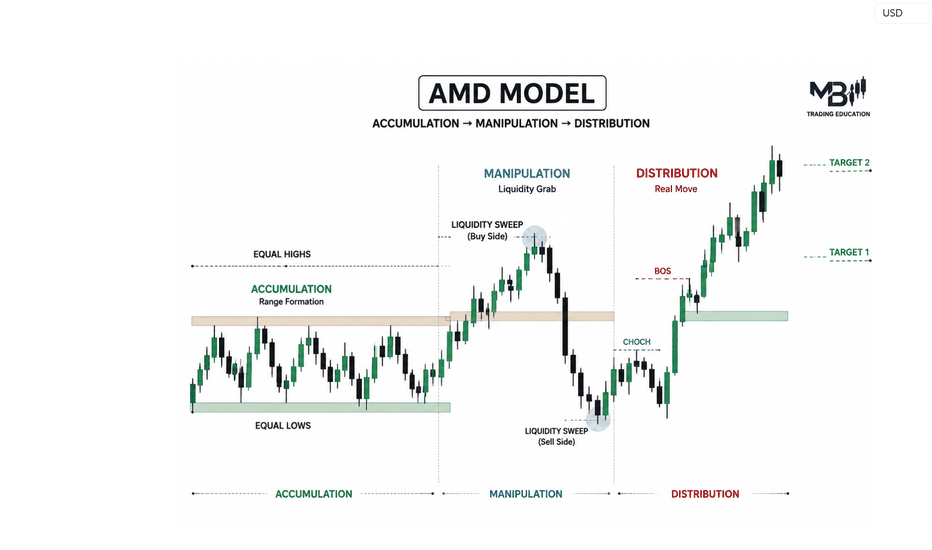
AMD Model Explained: The Hidden Cycle of Smart MoneyAMD MODEL (Accumulation → Manipulation → Distribution) | Complete Institutional Trading Education
Understanding The Logic Behind Market Movement
The AMD Model is an advanced Smart Money Concept that explains the natural cycle of institutional price movement. The market does not move randomly; large institutions require liquidity and order flow to execute their positions. Because of this, price often follows a sequence:
Accumulation → Manipulation → Distribution
Understanding this cycle helps
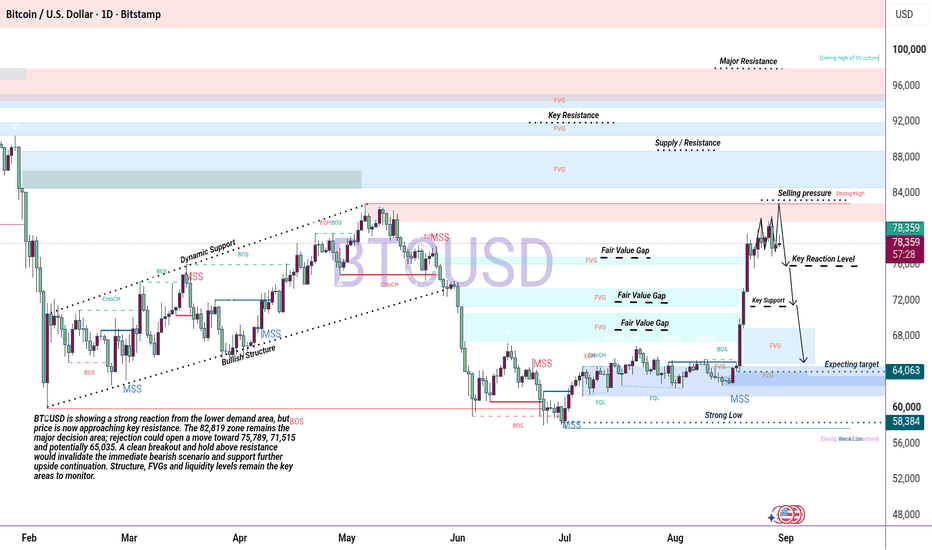
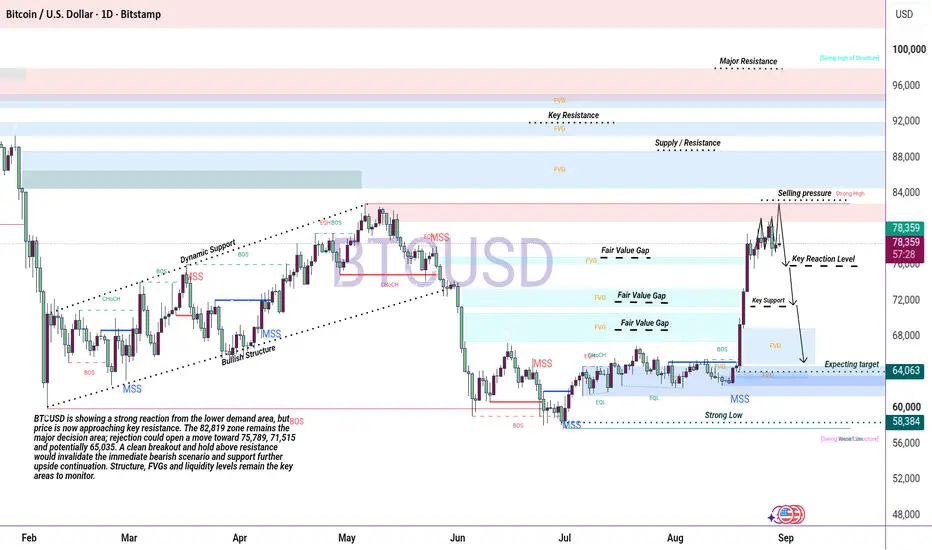
BTCUSD | Institutional Market Structure & Liquidity AnalysisBTCUSD | Institutional Market Structure & Liquidity Analysis
This Bitcoin 1D analysis provides a detailed candle-by-candle study of market structure, liquidity, Fair Value Gaps (FVG), Market Structure Shifts (MSS), Break of Structure (BOS), and key supply and demand areas.
The chart begins with strong bearish pressure, where consecutive candles pushed price lower and established an important swing low. After this decline, price entered a consolidation phase, allowing buyers to build a base and
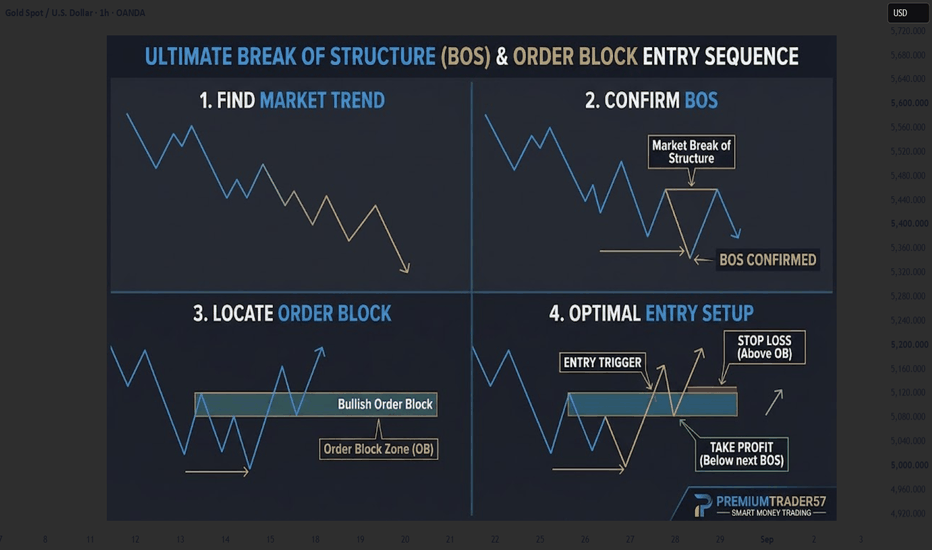
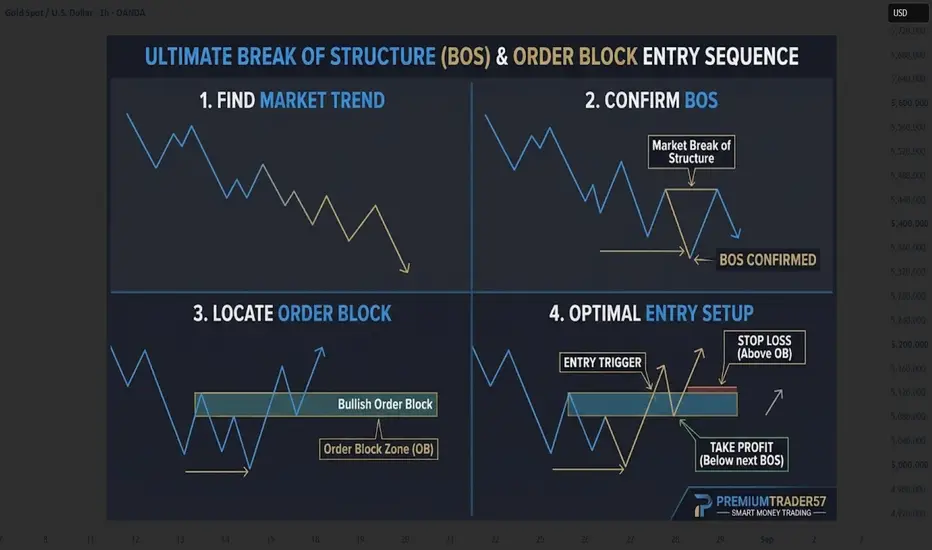
How to Trade Break of Structure (BOS) & Order Blocks (SMC) ?**🚀 How to Trade Break of Structure (BOS) & Order Blocks (SMC)**
The fundamental sequence that powers Smart Money trading. Here’s a 4-step framework to identify and execute high-probability trade setups based on market structure changes.
---
### **1. Find the Market Trend**
Before you can spot a reversal, you must identify the current established order flow. Identify if the price is making:
* **Higher Highs & Higher Lows (Uptrend)**
* **Lower Lows & Lower Highs (Downtrend)**
> **Golden Rul
Mastering Smart Money Concepts (SMC): How Institutional Trading Smart Money Concepts (SMC) focuses on tracking institutional order flow—the footprints left behind by banks, hedge funds, and market makers. Rather than chasing retail chart patterns, SMC maps out institutional liquidity, structural shifts, and market imbalances to find high-probability trade setups.
1. CHoCH (Change of Character) 🔄
What it is: The first sign of a potential trend reversal.
How it works: In an uptrend, market structure forms a sequence of Higher Highs (HH) and Higher Lows (HL)
JPYUSD: The Road to Liquidity🔹 JPYUSD has shown a strong bullish displacement from the 0.00610–0.00615 demand area, followed by a Break of Structure and a move toward the 0.00640–0.00642 resistance zone. Price is now retracing from the upper range, with a bearish CHoCH visible around the 0.00634–0.00635 area. The current structure suggests a corrective phase, while the 0.006217 level and the lower 0.00610 area remain important liquidity zones.
🔸 From the current price action, JPYUSD could experience a corrective move towar
ETHUSDT: CVD Bull Div Method B, Projected Path to POCGate one, BOS confirmed bullish structure had already shifted near 1,880 before the pullback into the OTE zone.
Gate two, price swept the TCW OTE ETH LONG zone, tagging just above 1,800 with CVD Bull Div confirming at the same level marked here: price pressing toward a lower low while cumulative volume delta held a higher low, order flow disagreeing with the wick the same way it has on every prior instance of this exact setup type.
Gate three, CHoCH confirmed once price reclaimed back through
ETHUSDT: Weekly Resistance Rejection Short, Both TPs FilledGate one, BOS confirmed bullish structure had shifted at 1,905 heading into the push toward Weekly Resistance, the setup here is a fade of that move rather than a continuation of the immediate short-term trend.
Gate two, price ran directly into Weekly Resistance at 1,938.72, tagging the 0.236 to 0.295 fib band just under the level and failing to clear it. The rejection wick sat right at the resistance itself, no meaningful push through it.
Gate three, CHoCH confirmed once price broke back belo
Gold SMC Analysis | Institutional Bearish Setup
XAUUSD continues to trade within a significant Smart Money Concept (SMC) structure, where price is currently reacting around a major demand and support region after a prolonged correction from the highs. The overall market structure remains constructive on the higher timeframe, with key institutional levels clearly defining the next directional move.
The descending trendline represents the current bearish pressure; however, price is approaching a critical area where liquidity has been buildin
Trading Basics Ep.4 — Change of Character (CHoCH) Explained
Change of Character (CHoCH) is an early indication that the current trend may be losing strength and a potential reversal could be developing.
Unlike BOS, which confirms trend continuation, CHoCH suggests that market behavior is changing.
In a bullish trend:
Price typically forms HH + HL. If price breaks below a significant Higher Low (HL), a Bearish CHoCH may occur.
In a bearish trend:
Price typically forms LH + LL. If price breaks above a significant Lower High (LH), a Bullish CHoCH may o